
Compare HPL Electric with Similar Stocks
Stock DNA
Other Electrical Equipment
INR 2,149 Cr (Small Cap)
23.00
52
0.30%
0.67
9.51%
2.16
Total Returns (Price + Dividend) 
Latest dividend: 0.9968470835522859 per share ex-dividend date: Sep-22-2025
Risk Adjusted Returns v/s
Returns Beta

News
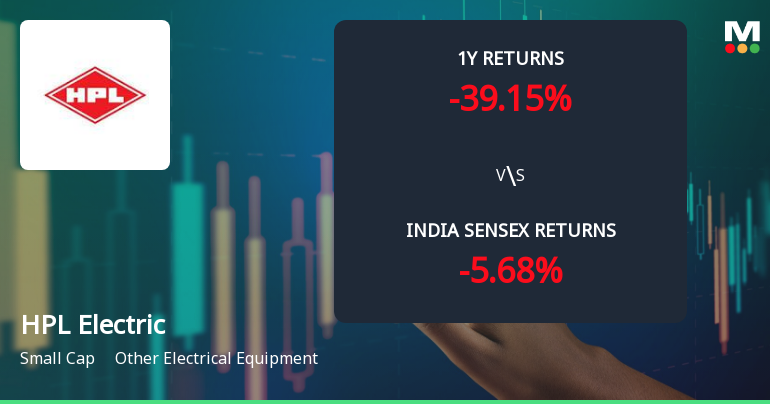
HPL Electric & Power Ltd Faces Bearish Momentum Amid Technical Downgrade
HPL Electric & Power Ltd has experienced a notable shift in its technical momentum, with key indicators signalling a bearish trend across multiple timeframes. Despite a modest intraday price gain, the stock’s broader technical landscape suggests caution for investors amid deteriorating momentum and a recent downgrade in its Mojo Grade to Sell.
Read full news article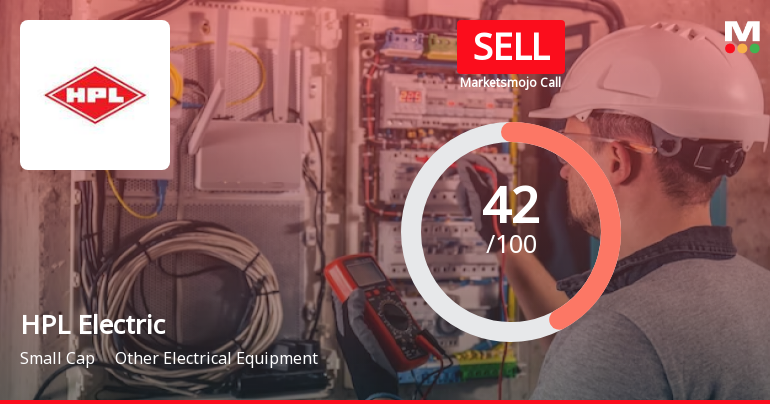
HPL Electric & Power Ltd is Rated Sell
HPL Electric & Power Ltd is rated Sell by MarketsMOJO. This rating was last updated on 13 May 2026. However, the analysis and financial metrics discussed below reflect the stock’s current position as of 21 July 2026, providing investors with the latest insights into the company’s performance and outlook.
Read full news article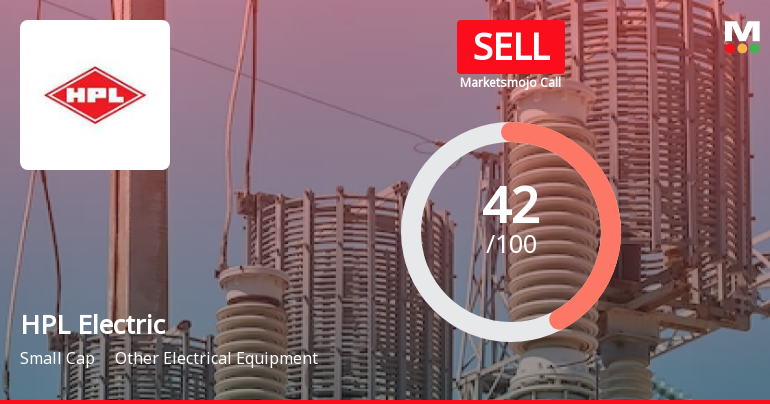
HPL Electric & Power Ltd is Rated Sell
HPL Electric & Power Ltd is rated Sell by MarketsMOJO, with this rating last updated on 13 May 2026. However, the analysis and financial metrics discussed here reflect the stock's current position as of 10 July 2026, providing investors with an up-to-date view of the company’s fundamentals, returns, and market standing.
Read full news article Announcements
HPL Electric & Power Limited - Press Release
15-Nov-2019 | Source : NSEHPL Electric & Power Limited has informed the Exchange regarding a press release dated November 14, 2019, titled "HPL Electric and Power Ltd reports its Q2 FY2019-20 Results
HPL Electric & Power Limited - Analysts/Institutional Investor Meet/Con. Call Updates
13-Nov-2019 | Source : NSEHPL Electric & Power Limited has informed the Exchange regarding Analysts/Institutional Investor Meet/Con. Call Updates
Analysts\/Institutional Investor Meet\/Con. Call Updates
21-Sep-2019 | Source : NSE
| HPL Electric & Power Limited has informed the Exchange regarding Analysts/Institutional Investor Meet/Con. Call Updates |
Corporate Actions

No Upcoming Board Meetings

HPL Electric & Power Ltd has declared 10% dividend, ex-date: 22 Sep 25

No Splits history available

No Bonus history available

No Rights history available
Quality key factors
Valuation key factors
Technicals key factors
 Technical Indicator Scale: Bearish, Mildly Bearish, Sideways, Mildly Bullish, Bullish Turned
 Shareholding Snapshot : Jun 2026
Shareholding Compare (%holding)
Promoters
2.4187
Held by 0 Schemes
Held by 34 FIIs (0.75%)
Hpl India Limited (27.33%)
None
23.1%
Quarterly Results Snapshot (Consolidated) - Mar'26 - YoY

YoY Growth in quarter ended Mar 2026 is 5.51% vs 16.14% in Mar 2025
YoY Growth in quarter ended Mar 2026 is -16.91% vs 170.90% in Mar 2025
Half Yearly Results Snapshot (Consolidated) - Sep'25
Growth in half year ended Sep 2025 is 0.28% vs 21.46% in Sep 2024
Growth in half year ended Sep 2025 is 5.58% vs 115.12% in Sep 2024
Nine Monthly Results Snapshot (Consolidated) - Dec'25
YoY Growth in nine months ended Dec 2025 is 6.93% vs 16.49% in Dec 2024
YoY Growth in nine months ended Dec 2025 is 6.22% vs 89.65% in Dec 2024
Annual Results Snapshot (Consolidated) - Mar'26
YoY Growth in year ended Mar 2026 is 6.52% vs 16.39% in Mar 2025
YoY Growth in year ended Mar 2026 is -2.94% vs 115.27% in Mar 2025
About HPL Electric & Power Ltd

Company Coordinates


