
Compare Hubtown with Similar Stocks
Dashboard
Weak Long Term Fundamental Strength with an average Return on Capital Employed (ROCE) of 2.29%
- Company's ability to service its debt is weak with a poor EBIT to Interest (avg) ratio of 0.09
Flat results in Mar 26
With ROCE of 4.3, it has a Very Expensive valuation with a 1 Enterprise value to Capital Employed
Reducing Promoter Confidence
Total Returns (Price + Dividend) 
Latest dividend: 1 per share ex-dividend date: Sep-17-2014
Risk Adjusted Returns v/s
Returns Beta

News
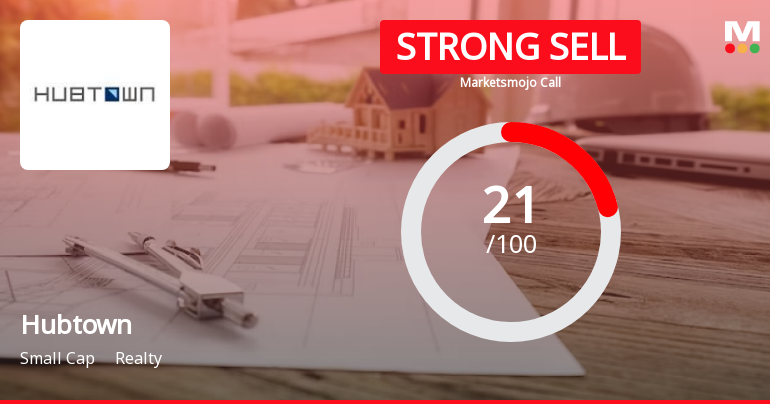
Hubtown Ltd is Rated Strong Sell
Hubtown Ltd is rated Strong Sell by MarketsMOJO, with this rating last updated on 13 February 2026. However, the analysis and financial metrics discussed here reflect the stock's current position as of 18 June 2026, providing investors with an up-to-date view of the company’s fundamentals, valuation, financial trends, and technical outlook.
Read full news article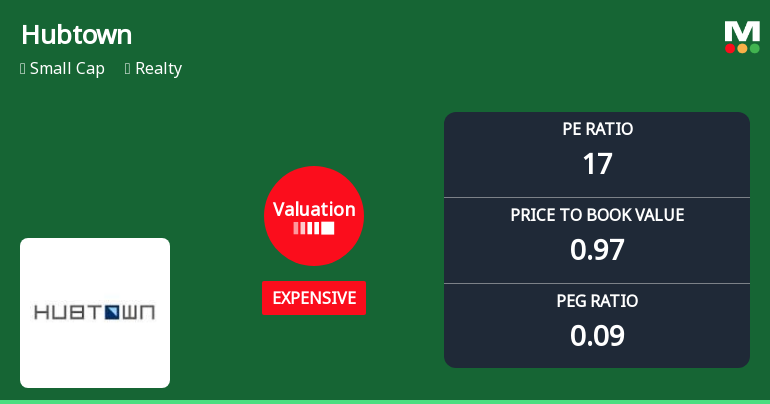
Hubtown Ltd Valuation Shifts Signal Price Attractiveness Amid Market Pressure
Hubtown Ltd, a small-cap player in the realty sector, has seen its valuation parameters shift notably, reflecting a change in price attractiveness that investors should carefully consider. Despite a strong long-term return record, recent market dynamics and valuation grade downgrades highlight growing concerns about the stock’s near-term appeal.
Read full news article
Hubtown Ltd is Rated Strong Sell
Hubtown Ltd is rated 'Strong Sell' by MarketsMOJO, with this rating last updated on 13 February 2026. However, the analysis and financial metrics discussed here reflect the company’s current position as of 08 June 2026, providing investors with an up-to-date view of the stock’s fundamentals, valuation, financial trend, and technical outlook.
Read full news article Announcements
Hubtown Limited - Outcome of Board Meeting
14-Nov-2019 | Source : NSEHubtown Limited has informed the Exchange regarding Board meeting held on November 13, 2019.
Hubtown Limited - Disclosure under SEBI Takeover Regulations
09-Oct-2019 | Source : NSEHubtown Limited has informed the Exchange regarding reason for encumbrance vide letter dated October 07, 2019 under SEBI ( SAST) Regulations, 2011.
Hubtown Limited - Shareholders meeting
26-Sep-2019 | Source : NSEHubtown Limited has informed the Exchange regarding Proceedings of Annual General Meeting held on September 25, 2019
Corporate Actions

No Upcoming Board Meetings

Hubtown Ltd has declared 10% dividend, ex-date: 17 Sep 14

No Splits history available

No Bonus history available

No Rights history available
Quality key factors
Valuation key factors
Technicals key factors
 Technical Indicator Scale: Bearish, Mildly Bearish, Sideways, Mildly Bullish, Bullish Turned
 Shareholding Snapshot : Mar 2026
Shareholding Compare (%holding)
Non Institution
16.074
Held by 0 Schemes
Held by 36 FIIs (1.4%)
Rushank Vyomesh Shah (4.05%)
Anand Rathi Global Finance Limited (2.62%)
32.5%
Quarterly Results Snapshot (Consolidated) - Mar'26 - QoQ

QoQ Growth in quarter ended Mar 2026 is 82.67% vs -57.99% in Dec 2025
QoQ Growth in quarter ended Mar 2026 is 2.10% vs -7.15% in Dec 2025
Half Yearly Results Snapshot (Consolidated) - Sep'25

Growth in half year ended Sep 2025 is 80.57% vs 81.48% in Sep 2024
Growth in half year ended Sep 2025 is 367.18% vs 1,892.79% in Sep 2024
Nine Monthly Results Snapshot (Consolidated) - Dec'25
YoY Growth in nine months ended Dec 2025 is 55.11% vs 105.17% in Dec 2024
YoY Growth in nine months ended Dec 2025 is 192.21% vs 1,235.71% in Dec 2024
Annual Results Snapshot (Consolidated) - Mar'26
YoY Growth in year ended Mar 2026 is 57.54% vs 58.49% in Mar 2025
YoY Growth in year ended Mar 2026 is 219.06% vs 154.51% in Mar 2025
About Hubtown Ltd

Company Coordinates


