
Compare Hypersoft Tech. with Similar Stocks
Dashboard
Poor Management Efficiency with a low ROE of 1.87%
- The company has been able to generate a Return on Equity (avg) of 1.87% signifying low profitability per unit of shareholders funds
The company is Net-Debt Free
Healthy long term growth as Net Sales has grown by an annual rate of %
The company has declared Positive results for the last 3 consecutive quarters
With ROE of 1.9, it has a Very Expensive valuation with a 7.7 Price to Book Value
Despite the size of the company, domestic mutual funds hold only 0% of the company
Stock DNA
Computers - Software & Consulting
INR 1,765 Cr (Micro Cap)
583.00
21
0.00%
-0.01
1.87%
7.74
Total Returns (Price + Dividend) 
Hypersoft Tech. for the last several years.
Risk Adjusted Returns v/s
Returns Beta

News

Broad-Based Technical Strength Lifts Hypersoft Technologies Ltd to 52-Week High of Rs 210.65
Surging to an all-time high of Rs 210.65 on 8 Jun 2026, Hypersoft Technologies Ltd has demonstrated remarkable price momentum, climbing from a 52-week low of Rs 21.32 to deliver a near tenfold increase over the past year. This rally is underscored by a confluence of bullish technical indicators that have propelled the stock well beyond its moving averages, even as the broader market struggles.
Read full news article
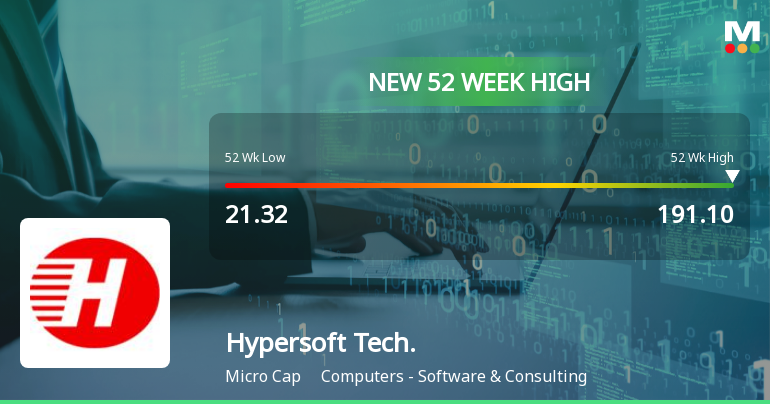
Broad-Based Technical Strength Lifts Hypersoft Technologies Ltd to 52-Week High of Rs 191.1
Surging to an all-time high of Rs 191.1 on 4 Jun 2026, Hypersoft Technologies Ltd has demonstrated remarkable price momentum, outperforming its sector by 5.18% today and extending a nine-day winning streak that has delivered a 32.34% return. This rally is underscored by a confluence of bullish technical indicators and sustained strength across multiple timeframes.
Read full news article Announcements
Intimation Of Submission Of Application For Reclassification Of One Of The Promoters From Promoter To Public Category Shareholder Of The Company Pursuant To Regulation 31A Of SEBI (Listing Obligations And Disclosure Requirements) Regulations 2015
05-Jun-2026 | Source : BSEAttached
Outcome Of Board Meeting- Approval Of The Request For Reclassification Of Mr. Sudhakara Varma Yarramraju From The Promoter Category To The Public Category Subject To Receipt Of Necessary Statutory And Regulatory Approvals
01-Jun-2026 | Source : BSEAttached
Compliances-Reg.24(A)-Annual Secretarial Compliance
30-May-2026 | Source : BSESubmission of Annual Secretarial Compliance Report for the year ended 31st March 2026
Corporate Actions

No Upcoming Board Meetings

No Dividend history available

No Splits history available

No Bonus history available

No Rights history available
Quality key factors
Valuation key factors
Technicals key factors
 Technical Indicator Scale: Bearish, Mildly Bearish, Sideways, Mildly Bullish, Bullish Turned
 Shareholding Snapshot : Mar 2026
Shareholding Compare (%holding)
Promoters
None
Held by 0 Schemes
Held by 0 FIIs
Narra Purna Babu (58.08%)
Cyberpath Systems Pte. Ltd. (16.1%)
1.92%
Quarterly Results Snapshot (Standalone) - Mar'26 - QoQ

QoQ Growth in quarter ended Mar 2026 is 830.00% vs -86.06% in Dec 2025
QoQ Growth in quarter ended Mar 2026 is 433.33% vs -81.05% in Dec 2025
Half Yearly Results Snapshot (Standalone) - Sep'25
Not Applicable: The company has declared_date for only one period
Not Applicable: The company has declared_date for only one period
Nine Monthly Results Snapshot (Standalone) - Dec'25
YoY Growth in nine months ended Dec 2025 is 8,118.52% vs -68.24% in Dec 2024
YoY Growth in nine months ended Dec 2025 is 343.21% vs -576.47% in Dec 2024
Annual Results Snapshot (Standalone) - Mar'26

YoY Growth in year ended Mar 2026 is 348.94% vs 869.88% in Mar 2025
YoY Growth in year ended Mar 2026 is 1,290.48% vs 131.34% in Mar 2025
About Hypersoft Technologies Ltd

Company Coordinates


