
Compare ICE Make Refrig. with Similar Stocks
Dashboard
Flat results in Mar 26
- INTEREST(Latest six months) At Rs 7.57 cr has Grown at 50.80%
- PAT(Latest six months) At Rs 11.58 cr has Grown at -20.58%
- PBT LESS OI(Q) At Rs 13.18 cr has Fallen at -15.51%
With ROCE of 9.9, it has a Expensive valuation with a 4.7 Enterprise value to Capital Employed
Despite the size of the company, domestic mutual funds hold only 0% of the company
Below par performance in long term as well as near term
Stock DNA
Industrial Manufacturing
INR 1,182 Cr (Micro Cap)
97.00
54
0.29%
1.14
9.17%
8.92
Total Returns (Price + Dividend) 
Latest dividend: 2.2 per share ex-dividend date: Sep-19-2025
Risk Adjusted Returns v/s
Returns Beta

News

ICE Make Refrigeration Ltd Faces Mildly Bearish Momentum Amid Technical Shifts
ICE Make Refrigeration Ltd, a micro-cap player in the industrial manufacturing sector, has experienced a subtle shift in its technical momentum, moving from a sideways trend to a mildly bearish stance. Recent technical indicators including MACD, Bollinger Bands, and KST suggest caution, while moving averages offer a modestly bullish counterpoint. This nuanced picture emerges amid a stock price retreat and a downgrade in the company’s mojo grade from Hold to Sell.
Read full news article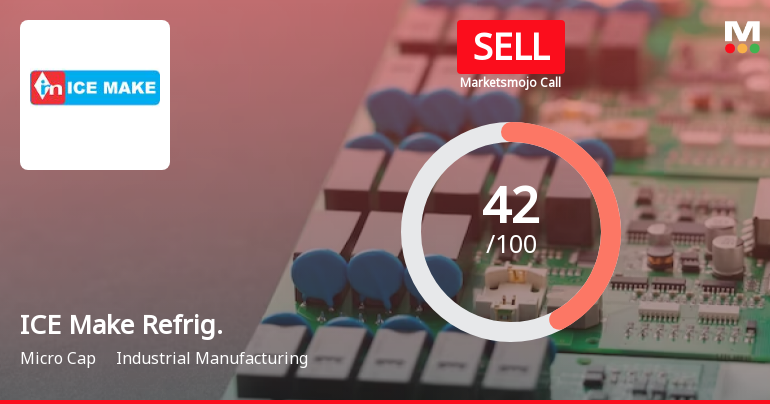
ICE Make Refrigeration Ltd is Rated Sell
ICE Make Refrigeration Ltd is rated Sell by MarketsMOJO, with this rating last updated on 8 June 2026. However, the analysis and financial metrics discussed here reflect the stock’s current position as of 17 June 2026, providing investors with the most up-to-date view of the company’s fundamentals, returns, and market standing.
Read full news article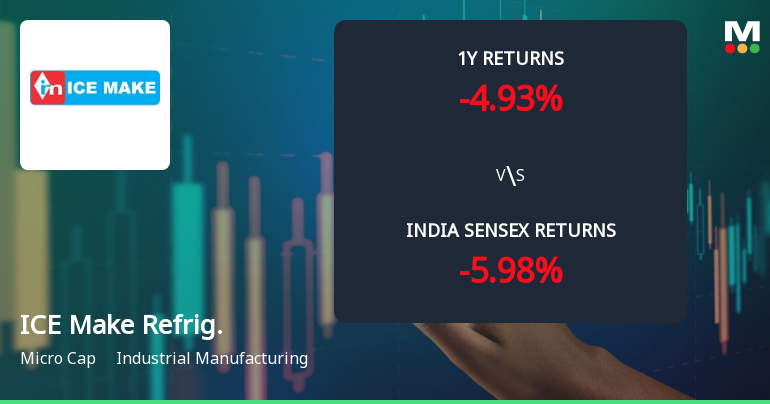
ICE Make Refrigeration Ltd Technical Momentum Shifts Amid Mixed Market Signals
ICE Make Refrigeration Ltd, a micro-cap player in the industrial manufacturing sector, has experienced a notable shift in its technical momentum, prompting a downgrade in its Mojo Grade from Hold to Sell as of 8 June 2026. Despite a modest daily price decline of 1.69%, the stock’s technical indicators reveal a complex picture of weakening bullish trends and emerging bearish signals, warranting a closer examination for investors navigating this evolving landscape.
Read full news article Announcements
Ice Make Refrigeration Limited - Analysts/Institutional Investor Meet/Con. Call Updates
13-Nov-2019 | Source : NSEIce Make Refrigeration Limited has informed the Exchange regarding Analysts/Institutional Investor Meet/Con. Call Updates
Corporate Actions

No Upcoming Board Meetings

ICE Make Refrigeration Ltd has declared 22% dividend, ex-date: 19 Sep 25

No Splits history available

No Bonus history available

No Rights history available
Quality key factors
Valuation key factors
Technicals key factors
 Technical Indicator Scale: Bearish, Mildly Bearish, Sideways, Mildly Bullish, Bullish Turned
 Shareholding Snapshot : Mar 2026
Shareholding Compare (%holding)
Promoters
None
Held by 0 Schemes
Held by 4 FIIs (0.22%)
Patel Rajendrabhai P (23.47%)
Niveshay Hedgehogs Fund (1.5%)
21.16%
Quarterly Results Snapshot (Consolidated) - Mar'26 - YoY

YoY Growth in quarter ended Mar 2026 is 41.86% vs 28.90% in Mar 2025
YoY Growth in quarter ended Mar 2026 is -13.66% vs -18.11% in Mar 2025
Half Yearly Results Snapshot (Consolidated) - Sep'25
Growth in half year ended Sep 2025 is 37.32% vs 20.88% in Sep 2024

Growth in half year ended Sep 2025 is -92.97% vs -13.66% in Sep 2024
Nine Monthly Results Snapshot (Consolidated) - Dec'25
YoY Growth in nine months ended Dec 2025 is 37.83% vs 25.46% in Dec 2024
YoY Growth in nine months ended Dec 2025 is -81.84% vs -4.20% in Dec 2024
Annual Results Snapshot (Consolidated) - Mar'26
YoY Growth in year ended Mar 2026 is 39.35% vs 26.73% in Mar 2025
YoY Growth in year ended Mar 2026 is -47.25% vs -11.96% in Mar 2025
About ICE Make Refrigeration Ltd

Company Coordinates


