
Compare Ideaforge Tech with Similar Stocks
Dashboard
Weak Long Term Fundamental Strength with an average Return on Equity (ROE) of 0%
- Poor long term growth as Operating profit has grown by an annual rate -202.78% of over the last 5 years
- Company's ability to service its debt is weak with a poor EBIT to Interest (avg) ratio of -11.67
With a growth in Net Sales of 347.04%, the company declared Very Positive results in Mar 26
Risky - Negative Operating Profits
Increasing Participation by Institutional Investors
Stock DNA
Aerospace & Defense
INR 4,066 Cr (Small Cap)
NA (Loss Making)
51
0.00%
-0.04
-2.84%
7.00
Total Returns (Price + Dividend) 
Ideaforge Tech for the last several years.
Risk Adjusted Returns v/s
Returns Beta

News
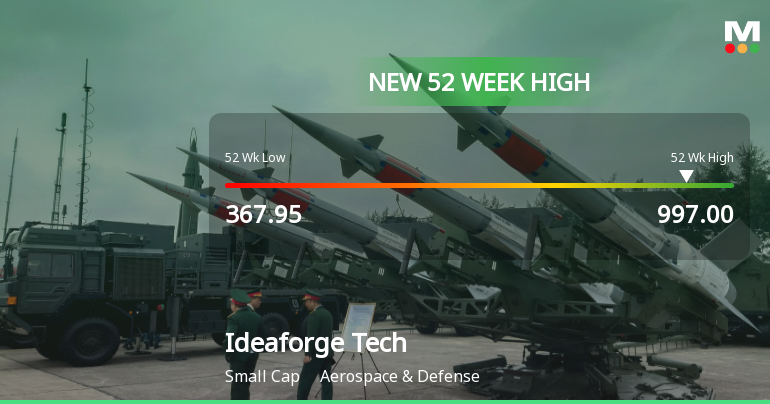
Broad-Based Technical Strength Lifts Ideaforge Technology Ltd to 52-Week High of Rs 997
Trading at a fresh 52-week high of Rs 997 on 10 Jun 2026, Ideaforge Technology Ltd has demonstrated remarkable price momentum, surging 56.76% over the past year against a Sensex decline of 9.76%. This milestone reflects a confluence of bullish technical signals that have propelled the stock well above its key moving averages.
Read full news article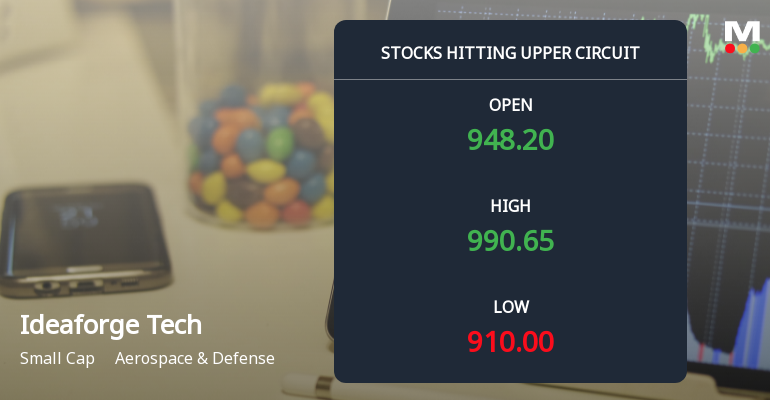
Ideaforge Technology Ltd Locks at Upper Circuit With 5.0% Gain — Buyers Queue, Sellers Absent
At Rs 992.25, the buying was done — not because demand dried up, but because the exchange wouldn't let the stock go any higher. Ideaforge Technology Ltd locked at its upper circuit of 5.0% on 08 Jun 2026, with buyers queuing and no sellers willing to part with shares.
Read full news article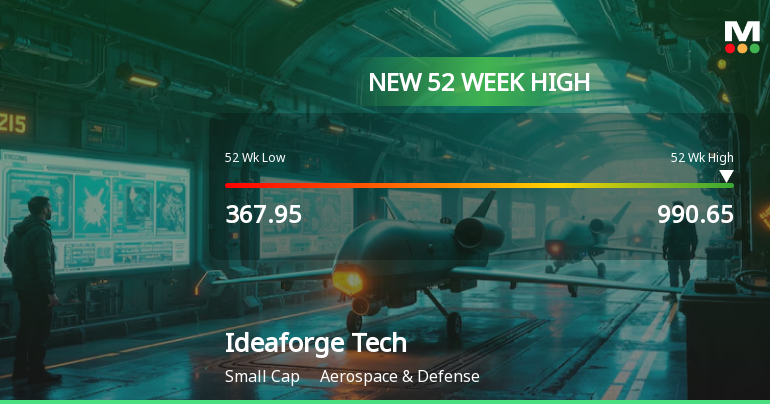
Broad-Based Technical Strength Lifts Ideaforge Technology Ltd to 52-Week High of Rs 990.65
With a remarkable 67.61% gain over the past year, Ideaforge Technology Ltd surged to a fresh 52-week high of Rs 990.65 on 8 Jun 2026, defying the broader market's subdued tone. This rally is underpinned by a confluence of bullish technical indicators and sustained price momentum, marking a significant milestone for the aerospace and defence small-cap.
Read full news article Announcements
Announcement under Regulation 30 (LODR)-Investor Presentation
07-Jun-2026 | Source : BSEInvestor Presentation for the Investor Meet
Announcement under Regulation 30 (LODR)-Credit Rating
05-Jun-2026 | Source : BSECredit Rating assigned to ideaForge Technology limited by India Ratings and Research Private Limited
Announcement under Regulation 30 (LODR)-Newspaper Publication
05-Jun-2026 | Source : BSENewspaper Advertisement for dispatch of the Postal Ballot Notice
Corporate Actions

No Upcoming Board Meetings

No Dividend history available

No Splits history available

No Bonus history available

No Rights history available
Quality key factors
Valuation key factors
Technicals key factors
 Technical Indicator Scale: Bearish, Mildly Bearish, Sideways, Mildly Bullish, Bullish Turned
 Shareholding Snapshot : Mar 2026
Shareholding Compare (%holding)
Non Institution
5.894
Held by 4 Schemes (1.03%)
Held by 17 FIIs (0.73%)
Ankit Mehta (8.52%)
Florintree Enterprise Llp (8.29%)
42.44%
Quarterly Results Snapshot (Consolidated) - Mar'26 - QoQ

QoQ Growth in quarter ended Mar 2026 is 347.04% vs -22.60% in Dec 2025
QoQ Growth in quarter ended Mar 2026 is 277.22% vs -72.53% in Dec 2025
Half Yearly Results Snapshot (Consolidated) - Sep'25

Growth in half year ended Sep 2025 is -56.57% vs 2.06% in Sep 2024
Growth in half year ended Sep 2025 is -244.06% vs -163.54% in Sep 2024
Nine Monthly Results Snapshot (Consolidated) - Dec'25
YoY Growth in nine months ended Dec 2025 is -39.61% vs -33.44% in Dec 2024
YoY Growth in nine months ended Dec 2025 is -110.64% vs -205.85% in Dec 2024
Annual Results Snapshot (Consolidated) - Mar'26
YoY Growth in year ended Mar 2026 is 40.26% vs -48.66% in Mar 2025
YoY Growth in year ended Mar 2026 is 72.66% vs -237.57% in Mar 2025
About Ideaforge Technology Ltd

Company Coordinates


