
Compare IFB Industries with Similar Stocks
Dashboard
Company has a Debt to Equity ratio (avg) of 0.06 times
With a growth in Net Profit of 62.13%, the company declared Very Positive results in Mar 26
With ROE of 15.5, it has a Very Attractive valuation with a 5.1 Price to Book Value
Majority shareholders : Promoters
Underperformed the market in the last 1 year
Stock DNA
Electronics & Appliances
INR 5,205 Cr (Small Cap)
33.00
52
0.00%
-0.23
15.49%
5.23
Total Returns (Price + Dividend) 
IFB Industries for the last several years.
Risk Adjusted Returns v/s
Returns Beta

News

IFB Industries Ltd is Rated Hold by MarketsMOJO
IFB Industries Ltd is rated 'Hold' by MarketsMOJO, with this rating last updated on 26 May 2026. However, the analysis and financial metrics discussed here reflect the stock's current position as of 08 June 2026, providing investors with an up-to-date view of the company’s fundamentals, valuation, financial trends, and technical outlook.
Read full news article
IFB Industries Ltd is Rated Hold by MarketsMOJO
IFB Industries Ltd is rated 'Hold' by MarketsMOJO, with this rating last updated on 26 May 2026. However, the analysis and financial metrics discussed here reflect the stock's current position as of 08 June 2026, providing investors with an up-to-date view of the company’s fundamentals, returns, and market standing.
Read full news article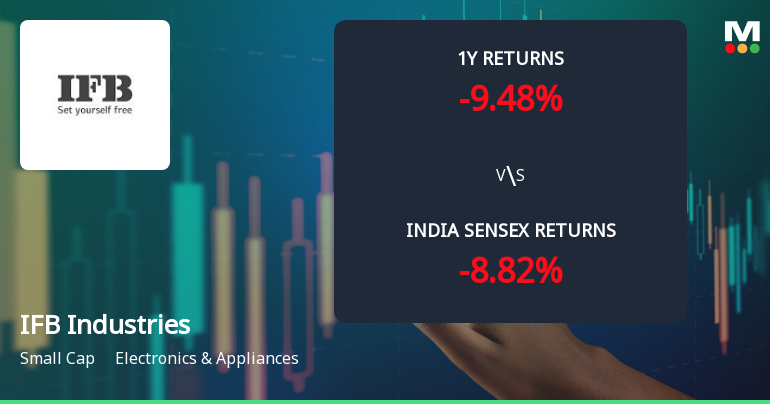
IFB Industries Ltd Technical Momentum Shifts Amid Mixed Market Signals
IFB Industries Ltd has experienced a notable shift in its technical momentum, moving from a sideways trend to a mildly bearish stance, reflecting a complex interplay of technical indicators. Despite a modest day gain of 0.39%, the stock’s mixed signals across weekly and monthly charts suggest cautious optimism for investors navigating the Electronics & Appliances sector.
Read full news article Announcements
Announcement under Regulation 30 (LODR)-Analyst / Investor Meet - Intimation
05-Jun-2026 | Source : BSEThe conference call with the Investors/Analysts is scheduled on 10th June 2026 at 04:00 P.M. (I.S.T.) to discuss the Audited Financial Results (Standalone & Consolidated) of the Company for the Quarter and Financial Year ended 31st March 2026.
Announcement under Regulation 30 (LODR)-Investor Presentation
05-Jun-2026 | Source : BSEInvestors Presentation of the Company for the Quarter and Financial Year ended 31st March 2026
Announcement under Regulation 30 (LODR)-Analyst / Investor Meet - Intimation
05-Jun-2026 | Source : BSEThe conference call with the Investors/Analysts is scheduled on 10th June 2026 at 04:00 P.M. (I.S.T.) to discuss the Audited Financial Results (Standalone & Consolidated) of the Company for the Quarter and Financial Year ended 31st March 2026.
Corporate Actions

No Upcoming Board Meetings

No Dividend history available

No Splits history available

No Bonus history available

No Rights history available
Quality key factors
Valuation key factors
Technicals key factors
 Technical Indicator Scale: Bearish, Mildly Bearish, Sideways, Mildly Bullish, Bullish Turned
 Shareholding Snapshot : Mar 2026
Shareholding Compare (%holding)
Promoters
None
Held by 16 Schemes (5.5%)
Held by 36 FIIs (0.92%)
Ifb Automotive Private Limited (46.54%)
Dsp Small Cap Fund (4.66%)
12.65%
Quarterly Results Snapshot (Consolidated) - Mar'26 - YoY

YoY Growth in quarter ended Mar 2026 is 12.33% vs 22.34% in Mar 2025

YoY Growth in quarter ended Mar 2026 is 126.13% vs 57.25% in Mar 2025
Half Yearly Results Snapshot (Consolidated) - Sep'25
Growth in half year ended Sep 2025 is 8.85% vs 13.80% in Sep 2024
Growth in half year ended Sep 2025 is 11.60% vs 229.75% in Sep 2024
Nine Monthly Results Snapshot (Consolidated) - Dec'25
YoY Growth in nine months ended Dec 2025 is 9.67% vs 12.26% in Dec 2024
YoY Growth in nine months ended Dec 2025 is 0.85% vs 160.79% in Dec 2024
Annual Results Snapshot (Consolidated) - Mar'26
YoY Growth in year ended Mar 2026 is 10.37% vs 14.73% in Mar 2025
YoY Growth in year ended Mar 2026 is 20.73% vs 136.12% in Mar 2025
About IFB Industries Ltd

Company Coordinates


