
Compare IHI Corp. with Similar Stocks
Dashboard
High Debt Company with a Debt to Equity ratio (avg) at times
- Poor long term growth as Net Sales has grown by an annual rate of 3.67% and Operating profit at 23.24% over the last 5 years
- High Debt Company with a Debt to Equity ratio (avg) at times
Strong Long Term Fundamental Strength with an average Return on Capital Employed (ROCE) of 8.10%
The company has declared Positive results for the last 5 consecutive quarters
With ROCE of 20.07%, it has a attractive valuation with a 3.49 Enterprise value to Capital Employed
Market Beating Performance
Stock DNA
Industrial Manufacturing
JPY 2,335,667 Million (Large Cap)
20.00
NA
0.00%
0.63
22.43%
4.76
Total Returns (Price + Dividend) 
IHI Corp. for the last several years.
Risk Adjusted Returns v/s
News
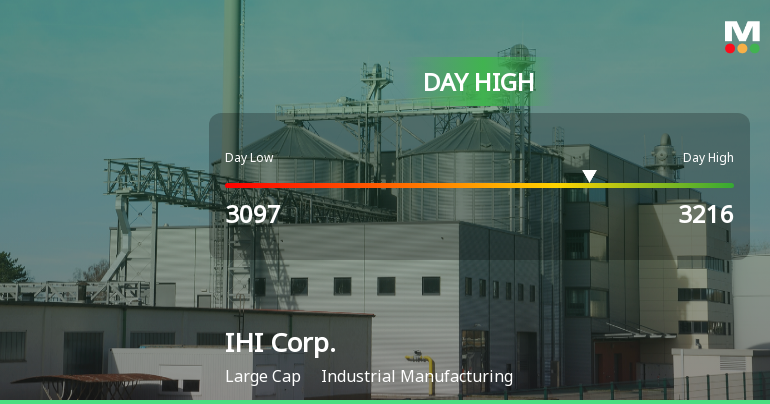
IHI Corp. Hits Day High with Strong 3.01% Intraday Surge
IHI Corp. has demonstrated strong stock performance, achieving significant gains over various timeframes, including a notable rise of 21.31% in the past month. The company has also reported impressive profit growth and a high return on equity, although it trades at a premium compared to its peers.
Read full news article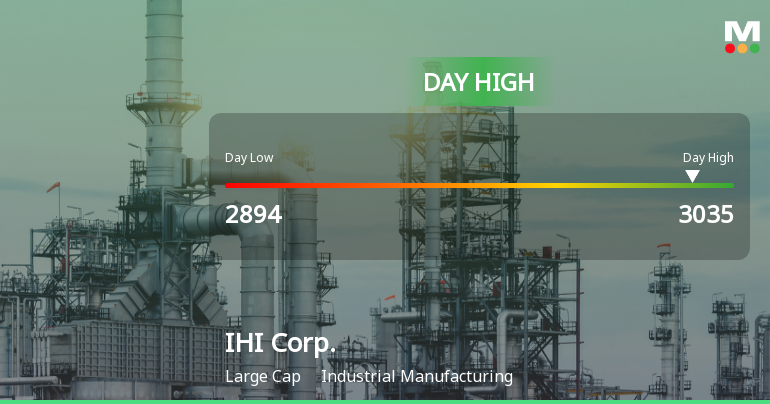
IHI Corp. Stock Soars to Day High with 4.73% Intraday Gain
IHI Corp., a key player in industrial manufacturing, has demonstrated significant stock volatility and responsiveness to market conditions. The company shows a mixed financial profile with a strong return on equity and impressive profit growth, yet it maintains a low dividend yield, indicating potential challenges ahead.
Read full news article Announcements

Corporate Actions
Quality key factors
Valuation key factors
Technicals key factors
 Technical Indicator Scale: Bearish, Mildly Bearish, Sideways, Mildly Bullish, Bullish Turned
 Shareholding Snapshot : Mar 2022
Shareholding Compare (%holding)
Foreign Institutions
Held in 0 Schemes (0%)
Held by 1 Foreign Institutions (0.02%)
Quarterly Results Snapshot (Consolidated) - Jun'25 - YoY

YoY Growth in quarter ended Jun 2025 is -2.98% vs 16.65% in Jun 2024
YoY Growth in quarter ended Jun 2025 is -36.77% vs 191.67% in Jun 2024
Annual Results Snapshot (Consolidated) - Mar'25

YoY Growth in year ended Mar 2025 is 23.00% vs -2.24% in Mar 2024
YoY Growth in year ended Mar 2025 is 280.87% vs -234.04% in Mar 2024
About IHI Corp.

Company Coordinates


