
Compare IKIO Tech with Similar Stocks
Dashboard
Poor Management Efficiency with a low ROE of 7.59%
- The company has been able to generate a Return on Equity (avg) of 7.59% signifying low profitability per unit of shareholders funds
Company has a Debt to Equity ratio (avg) of 0.01 times
Poor long term growth as Operating profit has grown by an annual rate -12.68% of over the last 5 years
With a growth in Net Profit of 62.83%, the company declared Outstanding results in Mar 26
With ROE of 6.3, it has a Attractive valuation with a 2.1 Price to Book Value
Majority shareholders : Promoters
Stock DNA
Electronics & Appliances
INR 1,230 Cr (Micro Cap)
33.00
56
0.00%
0.02
6.28%
2.05
Total Returns (Price + Dividend) 
Latest dividend: 1 per share ex-dividend date: Aug-13-2024
Risk Adjusted Returns v/s
Returns Beta

News

IKIO Technologies Ltd Technical Momentum Shifts Amid Mixed Market Signals
IKIO Technologies Ltd, a micro-cap player in the Electronics & Appliances sector, has experienced a notable shift in its technical momentum, moving from a sideways trend to a mildly bearish stance. Despite a recent downgrade in daily moving averages and mixed signals from key technical indicators, the stock’s performance relative to the broader market presents a nuanced picture for investors.
Read full news article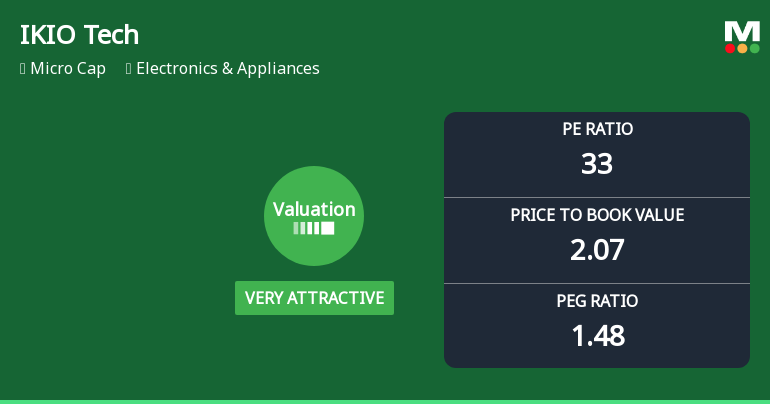
IKIO Technologies Ltd Valuation Shifts Signal Renewed Price Attractiveness
IKIO Technologies Ltd, a micro-cap player in the Electronics & Appliances sector, has seen a marked improvement in its valuation parameters, shifting from an 'attractive' to a 'very attractive' rating. This change reflects a significant reappraisal of the stock’s price metrics relative to its historical averages and peer group, suggesting a potential inflection point for investors evaluating its price-to-earnings and price-to-book value ratios amid a challenging market backdrop.
Read full news article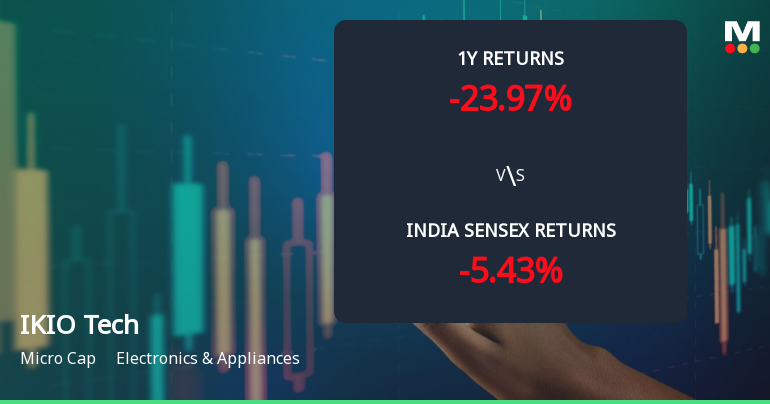
IKIO Technologies Ltd Technical Momentum Shifts Amid Mixed Market Signals
IKIO Technologies Ltd, a micro-cap player in the Electronics & Appliances sector, has recently exhibited a notable shift in its technical momentum, moving from a mildly bearish stance to a sideways trend. This transition is underscored by a complex interplay of technical indicators, including MACD, RSI, Bollinger Bands, and moving averages, which collectively paint a nuanced picture of the stock’s near-term prospects amid broader market challenges.
Read full news article Announcements
Disclosure Under Regulation 30 Of The SEBI(LODR) - Investors / Analysts Meet - Outcome
16-Jun-2026 | Source : BSEDisclosure under Regulation 30 of the SEBI (LODR) - Investors / Analysts meet - Outcome
Intimation Of Schedule Of Analyst/Institutional Investor Meetings Under The SEBI (Listing Obligations And Disclosure Requirements) Regulations 2015
11-Jun-2026 | Source : BSEIntimation of Schedule of Analyst / Institutional Investor Meetings under the SEBI (Listing Obligations and Disclosure Requirements) Regulations 2015
Newspaper Publication For The Postponement Of 10Th Annual General Meeting Of The Company
08-Jun-2026 | Source : BSENewspaper Publication for the Postponement of the 10th Annual General Meeting of the Company.
Corporate Actions

No Upcoming Board Meetings

IKIO Technologies Ltd has declared 10% dividend, ex-date: 13 Aug 24

No Splits history available

No Bonus history available

No Rights history available
Quality key factors
Valuation key factors
Technicals key factors
 Technical Indicator Scale: Bearish, Mildly Bearish, Sideways, Mildly Bullish, Bullish Turned
 Shareholding Snapshot : Mar 2026
Shareholding Compare (%holding)
Promoters
None
Held by 1 Schemes (1.19%)
Held by 5 FIIs (0.9%)
Hardeep Singh (42.78%)
Ganesh Srinivasan (1.29%)
22.21%
Quarterly Results Snapshot (Consolidated) - Mar'26 - QoQ

QoQ Growth in quarter ended Mar 2026 is 13.57% vs -11.34% in Dec 2025
QoQ Growth in quarter ended Mar 2026 is 79.43% vs -8.37% in Dec 2025
Half Yearly Results Snapshot (Consolidated) - Sep'25
Growth in half year ended Sep 2025 is 12.80% vs 11.40% in Sep 2024

Growth in half year ended Sep 2025 is -52.13% vs -20.91% in Sep 2024
Nine Monthly Results Snapshot (Consolidated) - Dec'25
YoY Growth in nine months ended Dec 2025 is 15.08% vs 8.87% in Dec 2024
YoY Growth in nine months ended Dec 2025 is -35.84% vs -34.85% in Dec 2024
Annual Results Snapshot (Consolidated) - Mar'26
YoY Growth in year ended Mar 2026 is 22.52% vs 10.94% in Mar 2025
YoY Growth in year ended Mar 2026 is 22.39% vs -48.97% in Mar 2025
About IKIO Technologies Ltd

Company Coordinates


