
Compare IKIO Tech with Similar Stocks
Stock DNA
Electronics & Appliances
INR 1,693 Cr (Micro Cap)
43.00
60
0.00%
0.02
6.28%
2.75
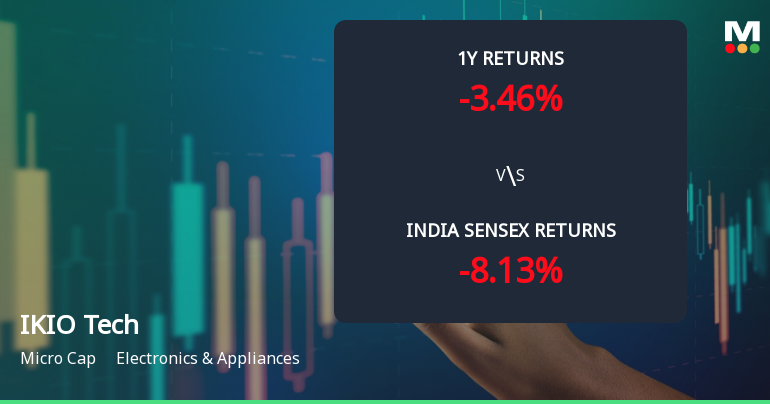
Total Returns (Price + Dividend) 
Latest dividend: 1 per share ex-dividend date: Aug-13-2024
Risk Adjusted Returns v/s
Returns Beta

News
IKIO Technologies Ltd Sees Technical Momentum Shift Amid Mixed Indicator Signals
IKIO Technologies Ltd, a micro-cap player in the Electronics & Appliances sector, has experienced a notable shift in its technical momentum, reflected in a 13.47% surge in its share price to ₹205.15 on 10 Jul 2026. This movement follows a transition from a sideways trend to a mildly bullish technical stance, although the company’s technical indicators present a nuanced picture, with mixed signals across key metrics such as MACD, RSI, and moving averages.
Read full news article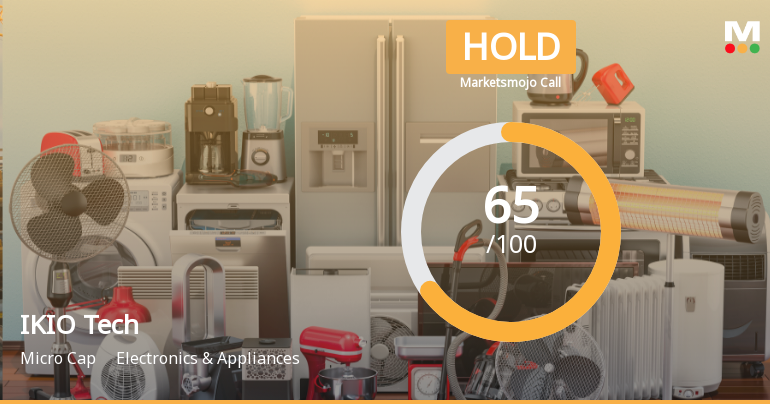
IKIO Technologies Downgraded to Hold Amid Mixed Technicals and Valuation Improvements
IKIO Technologies Ltd, a micro-cap player in the Electronics & Appliances sector, has seen its investment rating downgraded from Buy to Hold as of 7 July 2026. This revision follows a comprehensive reassessment of the company’s quality, valuation, financial trends, and technical indicators, reflecting a nuanced outlook despite some positive valuation shifts and strong recent financial performance.
Read full news article
IKIO Technologies Ltd Faces Technical Momentum Shift Amid Mixed Market Signals
IKIO Technologies Ltd, a micro-cap player in the Electronics & Appliances sector, has experienced a notable shift in its technical momentum, moving from a mildly bullish stance to a sideways trend. This transition is underscored by a complex interplay of technical indicators, including MACD, RSI, moving averages, and Bollinger Bands, signalling a period of consolidation after recent price volatility.
Read full news article Announcements
Corporate Actions

No Upcoming Board Meetings

IKIO Technologies Ltd has declared 10% dividend, ex-date: 13 Aug 24

No Splits history available

No Bonus history available

No Rights history available
Quality key factors
Valuation key factors
Technicals key factors
 Technical Indicator Scale: Bearish, Mildly Bearish, Sideways, Mildly Bullish, Bullish Turned
 Shareholding Snapshot : Mar 2026
Shareholding Compare (%holding)
Promoters
None
Held by 1 Schemes (1.19%)
Held by 5 FIIs (0.9%)
Hardeep Singh (42.78%)
Ganesh Srinivasan (1.29%)
22.21%
Quarterly Results Snapshot (Consolidated) - Mar'26 - QoQ

QoQ Growth in quarter ended Mar 2026 is 13.57% vs -11.34% in Dec 2025
QoQ Growth in quarter ended Mar 2026 is 79.43% vs -8.37% in Dec 2025
Half Yearly Results Snapshot (Consolidated) - Sep'25
Growth in half year ended Sep 2025 is 12.80% vs 11.40% in Sep 2024

Growth in half year ended Sep 2025 is -52.13% vs -20.91% in Sep 2024
Nine Monthly Results Snapshot (Consolidated) - Dec'25
YoY Growth in nine months ended Dec 2025 is 15.08% vs 8.87% in Dec 2024
YoY Growth in nine months ended Dec 2025 is -35.84% vs -34.85% in Dec 2024
Annual Results Snapshot (Consolidated) - Mar'26
YoY Growth in year ended Mar 2026 is 22.52% vs 10.94% in Mar 2025
YoY Growth in year ended Mar 2026 is 22.39% vs -48.97% in Mar 2025
About IKIO Technologies Ltd

Company Coordinates


