
Compare Imagica. Enter. with Similar Stocks
Dashboard
Weak Long Term Fundamental Strength with an average Return on Capital Employed (ROCE) of 4.69%
- Poor long term growth as Operating profit has grown by an annual rate 16.41% of over the last 5 years
- Low ability to service debt as the company has a high Debt to EBITDA ratio of 2.95 times
The company has declared Negative results for the last 4 consecutive quarters
With ROCE of 1.1, it has a Expensive valuation with a 1.9 Enterprise value to Capital Employed
Despite the size of the company, domestic mutual funds hold only 0% of the company
Below par performance in long term as well as near term
Stock DNA
Leisure Services
INR 2,699 Cr (Small Cap)
3,591.00
41
0.00%
0.25
0.06%
2.14
Total Returns (Price + Dividend) 
Imagica. Enter. for the last several years.
Risk Adjusted Returns v/s
Returns Beta

News

Imagicaaworld Entertainment Ltd is Rated Strong Sell
Imagicaaworld Entertainment Ltd is rated Strong Sell by MarketsMOJO. This rating was last updated on 08 Aug 2025, reflecting a significant reassessment of the stock’s outlook. However, all fundamentals, returns, and financial metrics discussed below are current as of 17 July 2026, providing investors with an up-to-date view of the company’s position.
Read full news article
Imagicaaworld Entertainment Ltd is Rated Strong Sell
Imagicaaworld Entertainment Ltd is rated Strong Sell by MarketsMOJO. This rating was last updated on 08 August 2025, reflecting a significant reassessment of the stock’s outlook. However, the analysis and financial metrics presented here are based on the company’s current position as of 06 July 2026, providing investors with the latest insights into its performance and prospects.
Read full news article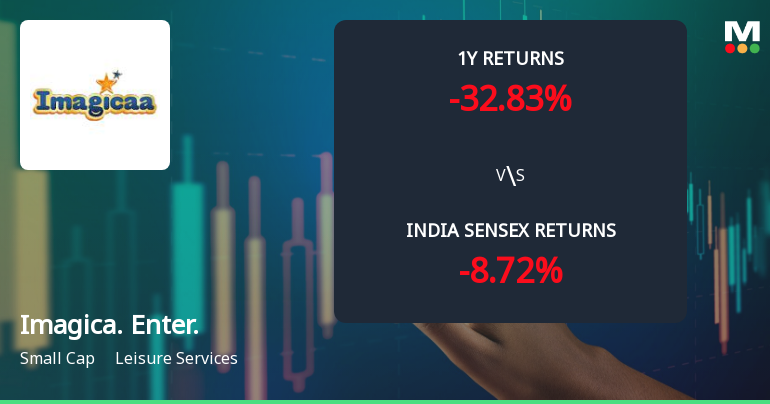
Imagicaaworld Entertainment Ltd Faces Mixed Technical Signals Amid Price Momentum Shift
Imagicaaworld Entertainment Ltd, a small-cap player in the Leisure Services sector, has experienced a notable shift in its technical momentum, signalling a transition from sideways trading to a mildly bearish trend. Recent technical indicators, including MACD, RSI, and moving averages, reveal a complex picture that investors must carefully analyse amid the stock’s underperformance relative to benchmarks like the Sensex.
Read full news article Announcements
Compliances-Certificate under Reg. 74 (5) of SEBI (DP) Regulations 2018
07-Jul-2026 | Source : BSEPlease find enclosed the certificate under Regulation 74(5) of SEBI (Depositories and Participants) Regulations 2018
Closure of Trading Window
25-Jun-2026 | Source : BSEPlease find enclosed herewith intimation of closure of trading window for dealing in the securities of the Company by the Designated persons and their immediate relatives which shall remain closed from Wednesday July 01 2026 till 48 hours after declaration of Unaudited Financial Results of the Company for the quarter ending on June 30 2026
Disclosure Under Regulation 30 Of The SEBI (Listing Obligations And Disclosure Requirements) Regulations 2015 -Regarding Resumption Of ImagicaaS Water Park At Khopoli
23-Jun-2026 | Source : BSEPlease find enclosed disclosure regarding resumption of Imagicaas Water Park situated at Khopoli
Corporate Actions

No Upcoming Board Meetings

No Dividend history available

No Splits history available

No Bonus history available

No Rights history available
Quality key factors
Valuation key factors
Technicals key factors
 Technical Indicator Scale: Bearish, Mildly Bearish, Sideways, Mildly Bullish, Bullish Turned
 Shareholding Snapshot : Jun 2026
Shareholding Compare (%holding)
Promoters
None
Held by 1 Schemes (0.0%)
Held by 23 FIIs (0.36%)
Malpani Parks Private Limited (74.02%)
Thrrill Park Limited (1.88%)
14.89%
Quarterly Results Snapshot (Consolidated) - Mar'26 - YoY

YoY Growth in quarter ended Mar 2026 is -2.69% vs 66.70% in Mar 2025
YoY Growth in quarter ended Mar 2026 is -97.46% vs 217.78% in Mar 2025
Half Yearly Results Snapshot (Consolidated) - Sep'25
Growth in half year ended Sep 2025 is -15.20% vs 59.30% in Sep 2024
Growth in half year ended Sep 2025 is -90.93% vs -88.80% in Sep 2024
Nine Monthly Results Snapshot (Consolidated) - Dec'25
YoY Growth in nine months ended Dec 2025 is -10.71% vs 51.73% in Dec 2024
YoY Growth in nine months ended Dec 2025 is -99.63% vs -88.29% in Dec 2024
Annual Results Snapshot (Consolidated) - Mar'26
YoY Growth in year ended Mar 2026 is -8.87% vs 52.38% in Mar 2025
YoY Growth in year ended Mar 2026 is -99.17% vs -85.74% in Mar 2025
About Imagicaaworld Entertainment Ltd

Company Coordinates


