
Compare Ind-Swift Labs. with Similar Stocks
Dashboard
Weak Long Term Fundamental Strength with a -138.33% CAGR growth in Operating Profits over the last 5 years
- Company's ability to service its debt is weak with a poor EBIT to Interest (avg) ratio of 1.67
- The company has been able to generate a Return on Equity (avg) of 7.99% signifying low profitability per unit of shareholders funds
With a growth in Net Sales of 22.82%, the company declared Very Positive results in Mar 26
Risky - Negative Operating Profits
Despite the size of the company, domestic mutual funds hold only 0% of the company
Stock DNA
Pharmaceuticals & Biotechnology
INR 1,452 Cr (Micro Cap)
29.00
34
0.00%
-0.31
3.61%
1.03
Total Returns (Price + Dividend) 
Latest dividend: 1 per share ex-dividend date: Sep-20-2011
Risk Adjusted Returns v/s
Returns Beta

News
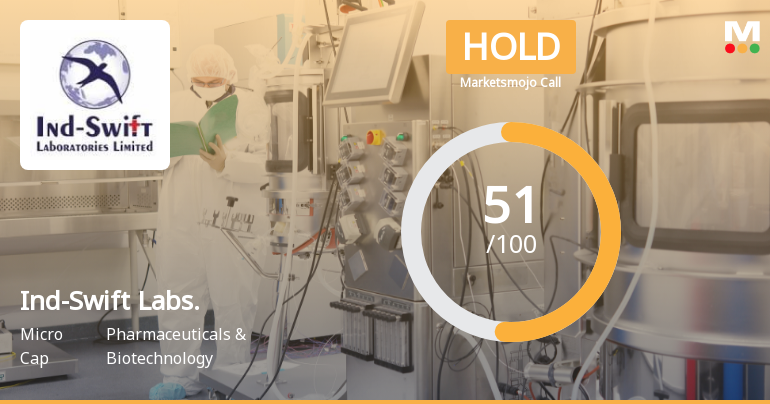
Ind-Swift Laboratories Ltd Upgraded to Hold on Technical and Financial Improvements
Ind-Swift Laboratories Ltd has seen its investment rating upgraded from Sell to Hold, reflecting a notable improvement in technical indicators and recent financial results. The upgrade, effective from 1 June 2026, is driven by enhanced technical trends, robust quarterly sales growth, and a strong market performance relative to benchmarks, despite lingering concerns over long-term fundamentals and profitability.
Read full news article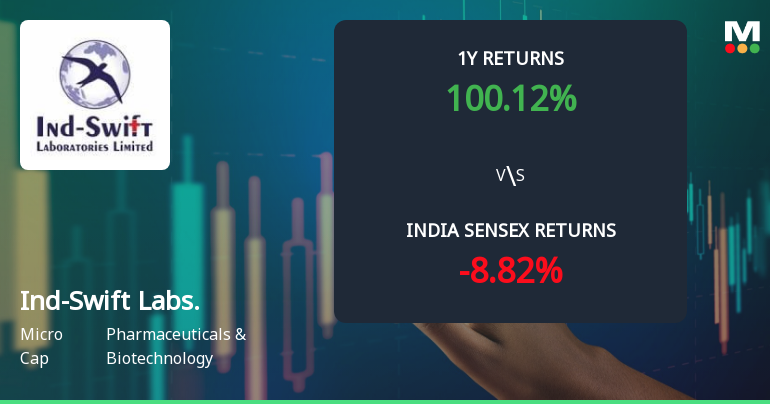
Ind-Swift Laboratories Ltd Sees Bullish Momentum Shift Amid Strong Technical Signals
Ind-Swift Laboratories Ltd has witnessed a significant shift in its technical momentum, moving from a mildly bullish stance to a more confident bullish trend. This change is underscored by strong weekly and monthly MACD signals, bullish moving averages, and a notable 8.00% gain in a single trading session, signalling renewed investor interest in this micro-cap pharmaceutical player.
Read full news article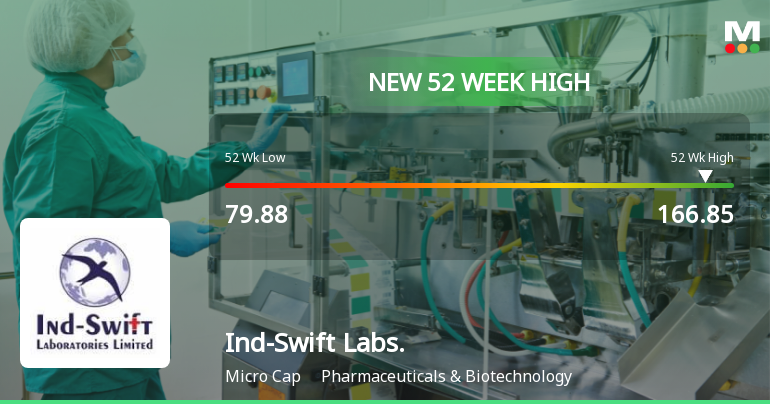
Broad-Based Technical Strength Lifts Ind-Swift Laboratories Ltd to 52-Week High of Rs 166.85
With a surge to Rs 166.85 on 1 Jun 2026, Ind-Swift Laboratories Ltd has reached a fresh 52-week high, marking a remarkable 95.55% gain over the past year. This milestone is underpinned by a confluence of technical indicators signalling sustained momentum, even as the broader Sensex trades near its own lows.
Read full news article Announcements
Compliances-Reg.24(A)-Annual Secretarial Compliance
30-May-2026 | Source : BSEPlease refer attached pdf.
Board Meeting Outcome for Audited Financial Results For The Quarter And Financial Year Ended 31St March 2026
28-May-2026 | Source : BSEAudited Financial results for the Quarter and Financial year ended 31st March 2026
Statement Of NIL Deviation For The Quarter Ended March 31 2026
28-May-2026 | Source : BSEPlease refer attached pdf.
Corporate Actions

No Upcoming Board Meetings

Ind-Swift Laboratories Ltd has declared 10% dividend, ex-date: 20 Sep 11

No Splits history available

No Bonus history available

No Rights history available
Quality key factors
Valuation key factors
Technicals key factors
 Technical Indicator Scale: Bearish, Mildly Bearish, Sideways, Mildly Bullish, Bullish Turned
 Shareholding Snapshot : Mar 2026
Shareholding Compare (%holding)
Non Institution
None
Held by 1 Schemes (0.0%)
Held by 9 FIIs (13.88%)
Essix Biosciences Limited (37.87%)
Hcp Investments (8.64%)
32.9%
Quarterly Results Snapshot (Consolidated) - Mar'26 - YoY

YoY Growth in quarter ended Mar 2026 is 22.82% vs -73.85% in Mar 2025

YoY Growth in quarter ended Mar 2026 is -93.20% vs -54.98% in Mar 2025
Half Yearly Results Snapshot (Consolidated) - Sep'25
Growth in half year ended Sep 2025 is 576.82% vs -92.48% in Sep 2024
Growth in half year ended Sep 2025 is 1,141.48% vs -97.24% in Sep 2024
Nine Monthly Results Snapshot (Consolidated) - Dec'25
YoY Growth in nine months ended Dec 2025 is 162.32% vs -80.40% in Dec 2024
YoY Growth in nine months ended Dec 2025 is 735.27% vs -106.06% in Dec 2024
Annual Results Snapshot (Consolidated) - Mar'26
YoY Growth in year ended Mar 2026 is 14.17% vs -67.14% in Mar 2025
YoY Growth in year ended Mar 2026 is -83.46% vs -53.51% in Mar 2025
About Ind-Swift Laboratories Ltd

Company Coordinates


