India Cem. Cap.

  • Market Cap: Micro Cap
  • Industry: Non Banking Financial Company (NBFC)
  • ISIN: INE429D01017
  • NSEID:
  • BSEID: 511355
INR
27.19
0.53 (1.99%)
BSENSE

Sep 01, 03:30 PM

BSE+NSE Vol: 33.59 k

  • Price Points
  • Score
  • Mojo Parameters
  • Total Return
  • News and Corporate Actions
  • Key factors
  • Shareholding
  • Financials
  • CompanyCV
stock-summaryPrice Point
High/Low

1Day

52 Week

Valuation
Technical
Day's Volume

CASH

33.59 k (-8.68%) Volume

Shareholding (Jun 2026)

FII

0.00%

Held by 0 FIIs

DII

0.00%

Held by 0 DIIs

Promoter

50.02%

Why is India Cements Capital Ltd falling/rising?

01-Sep-2026

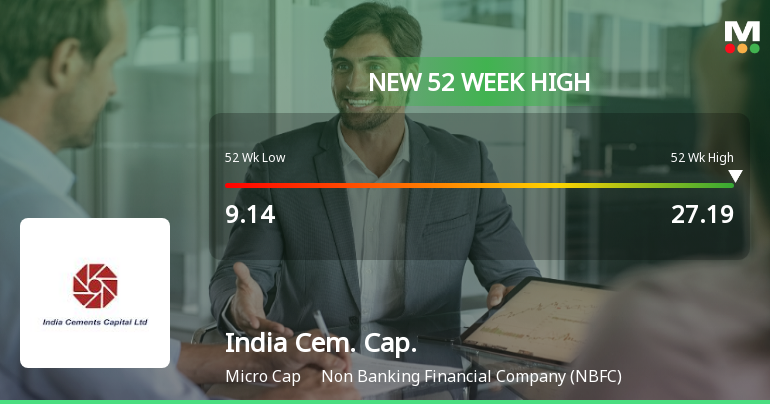
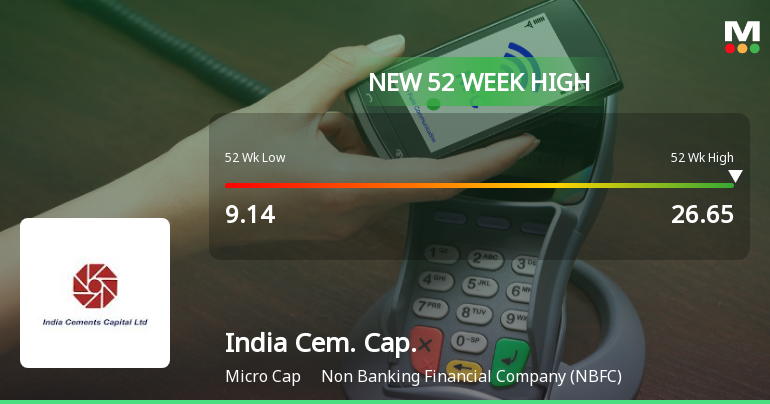
As of 31-Aug, India Cements Capital Ltd's stock price is at 26.66, reflecting a 1.99% increase. The stock has shown strong performance with a 91.66% year-to-date rise, despite a decline in investor participation.

As of 31-Aug, India Cements Capital Ltd's stock price is rising, currently at 26.66, which reflects a change of 0.52 or 1.99% increase. The stock has shown strong performance over various periods, with a notable 10.35% increase over the past week and a remarkable 23.83% rise over the past month. Year-to-date, the stock has surged by 91.66%, significantly outperforming the Sensex, which has declined by 9.70% during the same timeframe.<BR><BR>Today, the stock reached a new 52-week high of Rs. 26.66 and has outperformed its sector by 2.39%. Additionally, it has been on a consecutive gain streak for the last seven days, accumulating a total return of 14.77% in that period. The stock is also trading above its 5-day, 20-day, 50-day, 100-day, and 200-day moving averages, indicating a strong upward trend.<BR><BR>However, it is worth noting that there has been a decline in investor participation, with delivery volume dropping by 47.63% against the 5-day average. Despite this decrease in participation, the stock remains liquid enough for trading, suggesting that the price rise is supported by sufficient market activity. Overall, the combination of strong historical performance and current price momentum contributes to the rising stock price of India Cements Capital Ltd.

View full answer

Who are in the management team of India Cem. Cap.?

01-Sep-2026

The management team of India Cem. Cap. includes E Jayashree (Company Secretary), V M Mohan (Non-Executive Director), V Manickam (Chairman), and independent directors Lakshmi Aparna Sreekumar and Sandhya Rajan.

The management team of India Cem. Cap. includes the following individuals:<BR><BR>1. E Jayashree - Company Secretary & Compliance Officer<BR>2. V M Mohan - Non-Executive Director<BR>3. V Manickam - Chairman & Independent Director<BR>4. Lakshmi Aparna Sreekumar - Independent Director<BR>5. Sandhya Rajan - Independent Director<BR><BR>If you have any more questions about the company or its management, feel free to ask!

View full answer

What does India Cem. Cap. do?

01-Sep-2026

India Cements Capital Ltd is a micro-cap Non Banking Financial Company (NBFC) focused on money changing activities, including foreign exchange transactions for individuals and corporate clients. It is registered as an Authorized Dealer with the RBI and reported net sales of 1 Cr and a net profit of 0 Cr for June 2026.

Overview:<BR>India Cements Capital Ltd operates as a Non Banking Financial Company (NBFC) in the micro-cap category, specializing in money changing activities including the buying and selling of foreign exchange for individuals and corporate clients.<BR><BR>History:<BR>The company was formerly known as Aruna Sugars Finance and is controlled by the Aruna Sugars group. It is a registered Authorized Dealer (Category-II) with the RBI. The latest quarterly results reported net sales and net profit for June 2026.<BR><BR>Financial Snapshot:<BR>- Net Sales: 1 Cr (Quarterly Results - Jun 2026)<BR>- Net Profit: 0 Cr (Quarterly Results - Jun 2026)<BR>- Market-cap: INR 57 Cr (Micro Cap)<BR><BR>Key Metrics:<BR>- P/E: N/A (Loss Making)<BR>- Industry P/E: 21<BR>- Dividend Yield: 0.00%<BR>- Debt Equity: 0.00<BR>- Return on Equity: -1.12%<BR>- Price to Book: 3.17<BR><BR>Contact Details:<BR>Address: Dhun Building, 827 Anna Salai Chennai Tamil Nadu : 600002<BR>Tel: 91-044-28414503/28572600<BR>Email: secr@iccaps.com<BR>Website: http://www.iccaps.com

View full answer

Who are the peers of the India Cem. Cap.?

01-Sep-2026

Peers of India Cem. Cap. include Amrapali Capital, Leading Lea. Fin, Share Samadhan, and others. India Cem. Cap. has below-average management risk and growth but boasts the highest 1-year return at 61.77% among its peers.

Peers: The peers of India Cem. Cap. are Amrapali Capital, Leading Lea. Fin, Share Samadhan, 3P Land Hold., Ceejay Finance, Apoorva Leasing, Real Touch Fin, Ladderup Finance, Regis Industries, and Mega Corp.<BR><BR>Quality Snapshot: Excellent management risk is observed at Amrapali Capital, Leading Lea. Fin, Share Samadhan, Ceejay Finance, Real Touch Fin, Ladderup Finance, Regis Industries, and Mega Corp., while Average management risk is found at Leading Lea. Fin. Below Average management risk is noted for India Cem. Cap., Apoorva Leasing, 3P Land Hold., and the rest. Growth is excellent at Amrapali Capital, Leading Lea. Fin, and Real Touch Fin, while average growth is seen at Share Samadhan, Ladderup Finance, and the rest. Below Average growth is noted for India Cem. Cap., Apoorva Leasing, 3P Land Hold., and the rest. Excellent capital structure is present at Amrapali Capital, Leading Lea. Fin, Ceejay Finance, India Cem. Cap., Apoorva Leasing, Real Touch Fin, Ladderup Finance, Regis Industries, and Mega Corp., while good capital structure is found at 3P Land Hold.<BR><BR>Return Snapshot: The peer with the highest 1-year return is India Cem. Cap. at 61.77%, while the lowest is Leading Lea. Fin at -80.41%. India Cem. Cap.'s 1-year return is significantly higher than all its peers. Additionally, Ceejay Finance, Apoorva Leasing, and Regis Industries have negative six-month returns.

View full answer

How big is India Cem. Cap.?

01-Sep-2026

As of 31st August, India Cements Capital Ltd has a market capitalization of 57.00 Cr, with Net Sales of 4.84 Cr and a Net Profit loss of 0.62 Cr over the latest four quarters. Shareholder's Funds are 17.91 Cr, and Total Assets are 20.56 Cr.

As of 31st August, India Cements Capital Ltd has a market capitalization of 57.00 Cr, categorizing it as a Micro Cap company.<BR><BR>In the latest four quarters, the company reported Net Sales of 4.84 Cr. However, it experienced a loss of 0.62 Cr in Net Profit during the same period.<BR><BR>The latest annual reporting period for the balance sheet is March 2026. Shareholder's Funds are valued at 17.91 Cr, while Total Assets amount to 20.56 Cr.

View full answer

Are India Cements Capital Ltd latest results good or bad?

06-Aug-2026

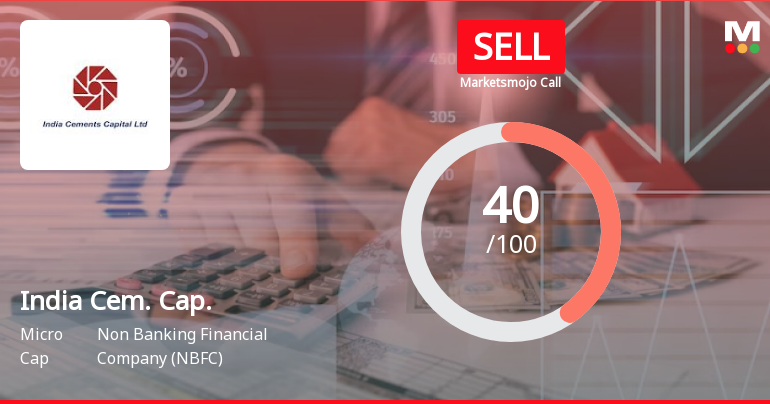
India Cements Capital Ltd's latest results show a return to profitability with a minimal net profit of ₹0.02 crores, but revenue has declined significantly, and the company faces ongoing operational challenges, leading to a "SELL" rating. Overall, the results are not strong enough to inspire optimism despite a recent stock price increase.

India Cements Capital Ltd's latest results present a mixed picture. On one hand, the company has returned to profitability with a net profit of ₹0.02 crores in Q1 FY27, a significant improvement from a loss of ₹0.39 crores in the previous quarter. However, this profit is quite minimal and represents an 88.89% decline compared to the ₹0.18 crores profit reported in the same quarter last year.<BR><BR>The revenue situation is concerning, as net sales decreased to ₹1.25 crores, marking an 11.97% decline year-on-year and a slight 0.79% decrease quarter-on-quarter. This contraction in revenue indicates ongoing challenges in expanding the business in a competitive foreign exchange market.<BR><BR>Additionally, the operating margin remains negative at -4.8%, although it has improved from the previous quarter's much worse performance. The company's overall financial health is further complicated by high employee costs, which consume over half of its revenues, and weak return metrics, including a return on equity (ROE) of -1.12%.<BR><BR>Despite a remarkable stock price increase of 42.60% over the past year, the operational challenges overshadow this momentum. The company carries a "SELL" rating, reflecting concerns about its ability to sustain profitability and improve its financial metrics in the future. Overall, while there are signs of recovery in profitability, the underlying operational issues suggest that the results are not strong enough to warrant optimism.

View full answer

Should I buy, sell or hold India Cements Capital Ltd?

05-Aug-2026

When is the next results date for India Cements Capital Ltd?

31-Jul-2026

The next results date for India Cements Capital Ltd is August 5, 2026.

The next results date for India Cements Capital Ltd is scheduled for August 5, 2026.

View full answer

How has been the historical performance of India Cem. Cap.?

09-Nov-2025

India Cem. Cap. experienced a decline in net sales and profitability from Mar'24 to Mar'25, with net sales dropping from 6.84 Cr to 5.55 Cr and profit after tax falling from 1.51 Cr to 0.56 Cr. Despite these challenges, total assets remained stable, and cash and cash equivalents increased from 13.43 Cr to 14.23 Cr.

Answer:<BR>The historical performance of India Cem. Cap. shows fluctuations in net sales and profitability over the years, with a notable decline in net sales from Mar'24 (6.84 Cr) to Mar'25 (5.55 Cr). The total operating income followed a similar trend, decreasing from 6.84 Cr in Mar'24 to 5.55 Cr in Mar'25. The company experienced an operating profit (PBDIT) of 0.88 Cr in Mar'25, down from 2.19 Cr in Mar'24, indicating a decline in operational efficiency. Profit before tax also decreased from 2.00 Cr in Mar'24 to 0.74 Cr in Mar'25, while profit after tax fell from 1.51 Cr to 0.56 Cr in the same period. The earnings per share (EPS) decreased from 0.70 in Mar'24 to 0.26 in Mar'25. On the balance sheet, total liabilities increased from 66.95 Cr in Mar'24 to 67.79 Cr in Mar'25, while total assets rose from 66.95 Cr to 67.79 Cr, reflecting a stable asset base despite the decline in profitability. The cash flow from operating activities remained at zero in Mar'25, consistent with the previous year, while the closing cash and cash equivalents increased from 13.43 Cr in Mar'24 to 14.23 Cr in Mar'25.<BR><BR>Breakdown:<BR>India Cem. Cap. has shown a mixed performance historically, with net sales peaking at 6.84 Cr in Mar'24 before dropping to 5.55 Cr in Mar'25. Total operating income mirrored this decline, while operating profit (PBDIT) decreased significantly from 2.19 Cr to 0.88 Cr, indicating challenges in maintaining operational profitability. Profit before tax and profit after tax also saw declines, with the latter falling from 1.51 Cr to 0.56 Cr, leading to a drop in EPS from 0.70 to 0.26. On the balance sheet, total liabilities increased slightly, reflecting a stable asset position, as total assets remained unchanged at 67.79 Cr. Cash flow from operating activities remained stagnant, but the company managed to increase its cash and cash equivalents, suggesting some liquidity improvement despite the overall decline in profitability.

View full answer

Is India Cem. Cap. overvalued or undervalued?

09-Jun-2025

As of November 11, 2024, India Cem. Cap. is considered overvalued with a PE ratio of 32.60 and an EV to EBIT ratio of 63.13, reflecting poor returns and a year-to-date performance of -20.01% compared to the Sensex's 5.59%.

As of 11 November 2024, India Cem. Cap. has moved from a fair valuation to very expensive. The company is currently overvalued, with a PE ratio of 32.60, an EV to EBIT ratio of 63.13, and a ROE of only 3.00%. In comparison to its peers, Life Insurance has a fair PE ratio of 12.54, while Bajaj Finance is also categorized as very expensive with a PE of 35.01. <BR><BR>The high valuation metrics, particularly the EV to EBITDA ratio of 63.13, indicate that investors are paying a premium for the stock without corresponding returns, as evidenced by a low ROCE of 0.65%. Additionally, the company's recent stock performance has lagged behind the Sensex, with a year-to-date return of -20.01% compared to the Sensex's 5.59%, reinforcing the notion that the stock is overvalued at its current price of 14.95.

View full answer

What is the technical trend for India Cem. Cap.?

09-Jun-2025

As of June 5, 2025, India Cem. Cap. shows a mildly bearish trend overall, with mixed signals from the MACD and KST across different time frames, while daily moving averages remain bearish.

As of 5 June 2025, the technical trend for India Cem. Cap. has changed from bearish to mildly bearish. The weekly MACD indicates a mildly bullish stance, while the monthly MACD is mildly bearish, suggesting mixed signals across time frames. The daily moving averages remain bearish, which adds to the overall cautious outlook. The Bollinger Bands on a monthly basis are mildly bearish, and the KST aligns with a mildly bullish weekly trend but is also mildly bearish monthly. The Dow Theory indicates a mildly bearish stance on the weekly chart, with no clear trend on the monthly. Overall, the current technical stance is mildly bearish, driven primarily by the bearish daily moving averages and mixed signals from the MACD and KST.

View full answer

Who are the top shareholders of the India Cem. Cap.?

06-Jun-2025

The top shareholder of India Cem. Cap. is Sri Saradha Logistics Private Limited, holding 74.9% of the shares, with individual investors owning 24.23%. There are no pledged promoter holdings, mutual funds, or foreign institutional investors involved.

The top shareholders of India Cem. Cap. are primarily the promoters, with Sri Saradha Logistics Private Limited holding the highest stake at 74.9%. There are no pledged promoter holdings, and individual investors collectively hold 24.23% of the shares. Additionally, there are no mutual funds or foreign institutional investors (FIIs) currently holding shares in the company.

View full answer

Has India Cem. Cap. declared dividend?

06-Jun-2025

No Dividend History Available

iScoreScore
Click here to find our call on this stock
Strong Sell
Sell
Hold
Buy
Strong Buy

Dashboard

1

With a Operating Losses, the company has a Weak Long Term Fundamental Strength

  • Poor long term growth as Operating profit has grown by an annual rate of -3.66%
2

Flat results in Jun 26

3

Risky - Negative EBITDA

stock-summaryMojo Parameters

Mojo Parameters

Loading Valuation Snapshot...

Stock DNA

stock-summary
Industry

Non Banking Financial Company (NBFC)

stock-summary
Market cap

INR 58 Cr (Micro Cap)

stock-summary
P/E

NA (Loss Making)

stock-summary
Industry P/E

21

stock-summary
Dividend Yield

0.00%

stock-summary
Debt Equity

0.00

stock-summary
Return on Equity

-1.12%

stock-summary
Price to Book

3.23

Revenue and Profits:
Net Sales:
1 Cr
(Quarterly Results - Jun 2026)
Net Profit:
0 Cr
stock-summaryTotal Returns
Total Returns (Price + Dividend) stock-summary
Dividend Yield (0%)
TimePeriod
Price Return
Dividend Return
Total Return
3 Months
66.71%
0%
66.71%
6 Months
121.06%
0%
121.06%
1 Year
64.69%
0%
64.69%
2 Years
26.23%
0%
26.23%
3 Years
140.62%
0%
140.62%
4 Years
118.04%
0%
118.04%
5 Years
269.43%
0%
269.43%

India Cem. Cap. for the last several years.

Risk Adjusted Returns v/s stock-summary
Returns Beta
Icon
Beta has not been calculated since enough price history is not available
stock-summaryNews & Corporate Actions

Announcements stock-summary

Announcement under Regulation 30 (LODR)-Newspaper Publication

22-Aug-2026 | Source : BSE

Announcement under Regulation 30 (LODR)-Newspaper Publication.

Reg. 34 (1) Annual Report.

21-Aug-2026 | Source : BSE

Annual Report 2026

Announcement under Regulation 30 (LODR)-Newspaper Publication

20-Aug-2026 | Source : BSE

Announcement under Regulation 30 (LODR)- Newspaper Publication.

Corporate Actions stock-summary

stock-summary
BOARD MEETING

No Upcoming Board Meetings

stock-summary
DIVIDEND

No Dividend history available

stock-summary
SPLITS

No Splits history available

stock-summary
BONUS

No Bonus history available

stock-summary
RIGHTS

No Rights history available

stock-summaryKey Factors

Quality key factors stock-summary

Factor
Value
Sales Growth (5y)
21.74%
EBIT Growth (5y)
-3.66%
Net Debt to Equity (avg)
0
Institutional Holding
0.00%
ROE (avg)
3.51%

Valuation key factors

Factor
Value
P/E Ratio
NA (Loss Making)
Industry P/E
21
Price to Book Value
3.30
EV to EBIT
-47.83
EV to EBITDA
-47.83
EV to Capital Employed
7.12
EV to Sales
9.88
PEG Ratio
NA
Dividend Yield
NA
ROCE (Latest)
-8.78%
ROE (Latest)
-1.12%

Technicals key factors

Indicator
Weekly
Monthly
MACD
Bullish
Bullish
RSI
No Signal
No Signal
Bollinger Bands
Bullish
Bullish
Moving Averages
Bullish (Daily)
KST
Bullish
Bullish
Dow Theory
Bullish
Bullish
stock-summary Technical Indicator Scale: Bearish, Mildly Bearish, Sideways, Mildly Bullish, Bullish  Turned 
stock-summaryShareholding
Shareholding Snapshot : Jun 2026stock-summary
Shareholding Compare (%holding) stock-summary
Majority shareholders

Promoters

Pledged Promoter Holdings

None

Mutual Funds

Held by 1 Schemes (0.0%)

FIIs

Held by 0 FIIs

Promoter with highest holding

Sri Saradha Logistics Private Limited (50.02%)

Highest Public shareholder

Maitreyan Amarnath (23.64%)

Individual Investors Holdings

48.7%

stock-summaryFinancial
[
  {
    "link": "quarterly",
    "btn_text": "All Quarterly Results",
    "header": "Quarterly Results Snapshot (Consolidated) - Jun'26 - YoY",
    "rhs": [
      {
        "prefix": "Net Sales ",
        "suffix": "YoY Growth in quarter ended Jun 2026 is -11.97% vs -14.97% in Jun 2025",
        "dir": 1
      },
      {
        "prefix": "Consolidated Net Profit ",
        "suffix": "YoY Growth in quarter ended Jun 2026 is -88.89% vs -48.57% in Jun 2025",
        "dir": -1
      }
    ],
    "table": {
      "header": [
        "Jun'26",
        "Jun'25",
        "Change(%)"
      ],
      "body": [
        {
          "field": "Net Sales",
          "val1": "1.25",
          "val2": "1.42",
          "chgp": "-11.97%",
          "chgp_class": "negative"
        },
        {
          "field": "Operating Profit (PBDIT) excl Other Income",
          "val1": "-0.06",
          "val2": "0.17",
          "chgp": "-135.29%",
          "chgp_class": "negative"
        },
        {
          "field": "Interest",
          "val1": "0.01",
          "val2": "0.01",
          "chgp": "",
          "chgp_class": "neutral"
        },
        {
          "field": "Exceptional Items",
          "val1": "0.00",
          "val2": "0.00",
          "chgp": "",
          "chgp_class": "neutral"
        },
        {
          "field": "Consolidate Net Profit",
          "val1": "0.02",
          "val2": "0.18",
          "chgp": "-88.89%",
          "chgp_class": "negative"
        },
        {
          "field": "Operating Profit Margin (Excl OI)",
          "val1": "-4.80%",
          "val2": "11.97%",
          "chgp": "-16.77%",
          "chgp_class": "negative"
        }
      ]
    }
  },
  {
    "link": "half-yearly",
    "btn_text": "All Half Yearly Results",
    "header": "Half Yearly Results Snapshot (Consolidated) - Sep'25",
    "rhs": [
      {
        "prefix": "Net Sales ",
        "suffix": " Growth in half year ended Sep 2025 is -18.59% vs -15.45% in Sep 2024",
        "dir": -1
      },
      {
        "prefix": "Consolidated Net Profit ",
        "suffix": " Growth in half year ended Sep 2025 is -76.92% vs -54.39% in Sep 2024",
        "dir": -1
      }
    ],
    "table": {
      "header": [
        "Sep'25",
        "Sep'24",
        "Change(%)"
      ],
      "body": [
        {
          "field": "Net Sales",
          "val1": "2.54",
          "val2": "3.12",
          "chgp": "-18.59%",
          "chgp_class": "negative"
        },
        {
          "field": "Operating Profit (PBDIT) excl Other Income",
          "val1": "0.03",
          "val2": "0.53",
          "chgp": "-94.34%",
          "chgp_class": "negative"
        },
        {
          "field": "Interest",
          "val1": "0.02",
          "val2": "0.02",
          "chgp": "",
          "chgp_class": "neutral"
        },
        {
          "field": "Exceptional Items",
          "val1": "0.00",
          "val2": "0.00",
          "chgp": "",
          "chgp_class": "neutral"
        },
        {
          "field": "Consolidate Net Profit",
          "val1": "0.12",
          "val2": "0.52",
          "chgp": "-76.92%",
          "chgp_class": "negative"
        },
        {
          "field": "Operating Profit Margin (Excl OI)",
          "val1": "1.18%",
          "val2": "16.99%",
          "chgp": "-15.81%",
          "chgp_class": "negative"
        }
      ]
    }
  },
  {
    "link": "nine-monthly",
    "btn_text": "All Nine Monthly Results",
    "header": "Nine Monthly Results Snapshot (Consolidated) - Dec'25",
    "rhs": [
      {
        "prefix": "Net Sales ",
        "suffix": "YoY Growth in nine months ended Dec 2025 is -14.38% vs -17.67% in Dec 2024",
        "dir": 1
      },
      {
        "prefix": "Consolidated Net Profit ",
        "suffix": "YoY Growth in nine months ended Dec 2025 is -114.00% vs -63.50% in Dec 2024",
        "dir": -1
      }
    ],
    "table": {
      "header": [
        "Dec'25",
        "Dec'24",
        "Change(%)"
      ],
      "body": [
        {
          "field": "Net Sales",
          "val1": "3.75",
          "val2": "4.38",
          "chgp": "-14.38%",
          "chgp_class": "negative"
        },
        {
          "field": "Operating Profit (PBDIT) excl Other Income",
          "val1": "-0.02",
          "val2": "0.42",
          "chgp": "-104.76%",
          "chgp_class": "negative"
        },
        {
          "field": "Interest",
          "val1": "0.03",
          "val2": "0.03",
          "chgp": "",
          "chgp_class": "neutral"
        },
        {
          "field": "Exceptional Items",
          "val1": "-0.26",
          "val2": "0.00",
          "chgp": "",
          "chgp_class": "neutral"
        },
        {
          "field": "Consolidate Net Profit",
          "val1": "-0.07",
          "val2": "0.50",
          "chgp": "-114.00%",
          "chgp_class": "negative"
        },
        {
          "field": "Operating Profit Margin (Excl OI)",
          "val1": "-0.53%",
          "val2": "9.59%",
          "chgp": "-10.12%",
          "chgp_class": "negative"
        }
      ]
    }
  },
  {
    "link": "annual",
    "btn_text": "All Annual Results",
    "header": "Annual Results Snapshot (Consolidated) - Mar'26",
    "rhs": [
      {
        "prefix": "Net Sales ",
        "suffix": "YoY Growth in year ended Mar 2026 is -10.38% vs -18.27% in Mar 2025",
        "dir": 1
      },
      {
        "prefix": "Consolidated Net Profit ",
        "suffix": "YoY Growth in year ended Mar 2026 is -180.36% vs -62.91% in Mar 2025",
        "dir": -1
      }
    ],
    "table": {
      "header": [
        "Mar'26",
        "Mar'25",
        "Change(%)"
      ],
      "body": [
        {
          "field": "Net Sales",
          "val1": "5.01",
          "val2": "5.59",
          "chgp": "-10.38%",
          "chgp_class": "negative"
        },
        {
          "field": "Operating Profit (PBDIT) excl Other Income",
          "val1": "-0.53",
          "val2": "0.39",
          "chgp": "-235.90%",
          "chgp_class": "negative"
        },
        {
          "field": "Interest",
          "val1": "0.05",
          "val2": "0.07",
          "chgp": "-28.57%",
          "chgp_class": "positive"
        },
        {
          "field": "Exceptional Items",
          "val1": "-0.26",
          "val2": "0.00",
          "chgp": "",
          "chgp_class": "neutral"
        },
        {
          "field": "Consolidate Net Profit",
          "val1": "-0.45",
          "val2": "0.56",
          "chgp": "-180.36%",
          "chgp_class": "negative"
        },
        {
          "field": "Operating Profit Margin (Excl OI)",
          "val1": "-10.58%",
          "val2": "6.98%",
          "chgp": "-17.56%",
          "chgp_class": "negative"
        }
      ]
    }
  }
]

Quarterly Results Snapshot (Consolidated) - Jun'26 - YoYstock-summary

Jun'26
Jun'25
Change(%)
Net Sales
1.25
1.42
-11.97%
Operating Profit (PBDIT) excl Other Income
-0.06
0.17
-135.29%
Interest
0.01
0.01
Exceptional Items
0.00
0.00
Consolidate Net Profit
0.02
0.18
-88.89%
Operating Profit Margin (Excl OI)
-4.80%
11.97%
-16.77%
Values in Rs Cr.
Direction Arrows
Net Sales

YoY Growth in quarter ended Jun 2026 is -11.97% vs -14.97% in Jun 2025

Direction Arrows
Consolidated Net Profit

YoY Growth in quarter ended Jun 2026 is -88.89% vs -48.57% in Jun 2025

Half Yearly Results Snapshot (Consolidated) - Sep'25stock-summary

Sep'25
Sep'24
Change(%)
Net Sales
2.54
3.12
-18.59%
Operating Profit (PBDIT) excl Other Income
0.03
0.53
-94.34%
Interest
0.02
0.02
Exceptional Items
0.00
0.00
Consolidate Net Profit
0.12
0.52
-76.92%
Operating Profit Margin (Excl OI)
1.18%
16.99%
-15.81%
Values in Rs Cr.
Direction Arrows
Net Sales

Growth in half year ended Sep 2025 is -18.59% vs -15.45% in Sep 2024

Direction Arrows
Consolidated Net Profit

Growth in half year ended Sep 2025 is -76.92% vs -54.39% in Sep 2024

Nine Monthly Results Snapshot (Consolidated) - Dec'25stock-summary

Dec'25
Dec'24
Change(%)
Net Sales
3.75
4.38
-14.38%
Operating Profit (PBDIT) excl Other Income
-0.02
0.42
-104.76%
Interest
0.03
0.03
Exceptional Items
-0.26
0.00
Consolidate Net Profit
-0.07
0.50
-114.00%
Operating Profit Margin (Excl OI)
-0.53%
9.59%
-10.12%
Values in Rs Cr.
Direction Arrows
Net Sales

YoY Growth in nine months ended Dec 2025 is -14.38% vs -17.67% in Dec 2024

Direction Arrows
Consolidated Net Profit

YoY Growth in nine months ended Dec 2025 is -114.00% vs -63.50% in Dec 2024

Annual Results Snapshot (Consolidated) - Mar'26stock-summary

Mar'26
Mar'25
Change(%)
Net Sales
5.01
5.59
-10.38%
Operating Profit (PBDIT) excl Other Income
-0.53
0.39
-235.90%
Interest
0.05
0.07
-28.57%
Exceptional Items
-0.26
0.00
Consolidate Net Profit
-0.45
0.56
-180.36%
Operating Profit Margin (Excl OI)
-10.58%
6.98%
-17.56%
Values in Rs Cr.
Direction Arrows
Net Sales

YoY Growth in year ended Mar 2026 is -10.38% vs -18.27% in Mar 2025

Direction Arrows
Consolidated Net Profit

YoY Growth in year ended Mar 2026 is -180.36% vs -62.91% in Mar 2025

stock-summaryCompany CV
About India Cements Capital Ltd stock-summary
stock-summary
India Cements Capital Ltd
Micro Cap
Non Banking Financial Company (NBFC)
Controlled by the Aruna Sugars group, India Cements Capital & Finance Ltd (ICCL), formerly known as Aruna Sugars Finance is a RBI registered Authorized Dealer (Category-II) for money changing activities which includes selling and buying of Foreign Exchange in retail as well as wholesale to/for individuals and corporate clients. Further the Company is eligible to make outward remittances towards overseas education, medical treatment abroad and other permissible purposes.
Company Coordinates stock-summary
Company Details
Dhun Building, 827 Anna Salai Chennai Tamil Nadu : 600002
stock-summary
Tel: 91-044-28414503/28572600
stock-summary
secr@iccaps.com
Registrar Details
Cameo Corporate Services Ltd , Subramanian Buildings No 1 , Club House Road, Chennai