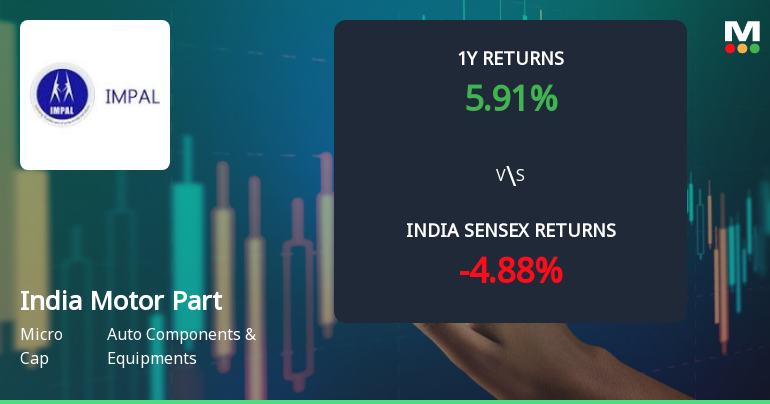
India Motor Part

  • Market Cap: Micro Cap
  • Industry: Auto Components & Equipments
  • ISIN: INE547E01014
  • NSEID: IMPAL
  • BSEID: 590065
INR
1,065.60
-12.1 (-1.12%)
BSENSE

Sep 18, 03:30 PM

BSE+NSE Vol: 2.16 k

  • Price Points
  • Score
  • Mojo Parameters
  • Total Return
  • News and Corporate Actions
  • Key factors
  • Shareholding
  • Financials
  • CompanyCV
stock-summaryPrice Point
High/Low

1Day

52 Week

Valuation
Technical
Day's Volume

CASH

2.16 k (18.11%) Volume

Shareholding (Jun 2026)

FII

0.76%

Held by 2 FIIs

DII

0.00%

Held by 0 DIIs

Promoter

35.21%

Why is India Motor Parts & Accessories Ltd falling/rising?

06-Sep-2026

As of 05-Sep, India Motor Parts & Accessories Ltd's stock price is rising to 1,123.35, but it is trading below key moving averages and experiencing declining investor participation, suggesting potential challenges ahead despite the short-term increase.

As of 05-Sep, India Motor Parts & Accessories Ltd's stock price is rising, currently at 1,123.35, reflecting a change of 8.35 (0.75%) upwards. This increase can be attributed to its performance relative to the benchmark Sensex, where the stock has outperformed over various periods, including a 2.59% gain over the past week compared to a 0.97% decline in the Sensex, and an 8.01% increase year-to-date against a 10.21% drop in the Sensex.<BR><BR>However, despite the current rise, there are concerning indicators. The stock is trading below its moving averages across multiple time frames, including the 5-day, 20-day, 50-day, 100-day, and 200-day averages, which typically suggests a bearish trend. Additionally, there has been a significant drop in investor participation, with delivery volume on September 3 falling by 65.58% compared to the 5-day average. This erratic trading pattern, where the stock did not trade on one day out of the last 20, further complicates the outlook.<BR><BR>In summary, while the stock is experiencing a short-term rise, the underlying factors such as declining investor participation and poor performance relative to moving averages indicate potential challenges ahead.

View full answer

Who are in the management team of India Motor Part?

01-Sep-2026

The management team of India Motor Part includes S Ram (Chairman), N Krishnan (Managing Director), Mukund S Raghavan (Deputy Managing Director), and several independent directors, overseeing the company's operations and strategic direction.

The management team of India Motor Part includes the following individuals:<BR><BR>1. **S Ram** - Chairman (Non-Executive)<BR>2. **Ananth Ramanujam** - Director<BR>3. **S Prasad** - Independent Director<BR>4. **Rasesh R Doshi** - Independent Director<BR>5. **N Krishnan** - Managing Director<BR>6. **S Kalyanaraman** - Company Secretary & Compliance Officer<BR>7. **S Venkatesan** - Independent Director<BR>8. **T N P Durai** - Independent Director<BR>9. **Sriya Chari** - Independent Director<BR>10. **Mukund S Raghavan** - Deputy Managing Director<BR>11. **Srivats Ram** - Director<BR><BR>This team is responsible for overseeing the company's operations and strategic direction.

View full answer

What does India Motor Part do?

01-Sep-2026

India Motor Parts & Accessories Ltd is a distributor of automobile spare parts in the Indian Automotive Aftermarket, with a market cap of INR 1,370 Cr and reported net sales of 234 Cr and net profit of 22 Cr for June 2026. The company has a P/E ratio of 17.00 and a dividend yield of 3.01%.

Overview: <BR>India Motor Parts & Accessories Ltd operates as a distributor for automobile spare parts in the Indian Automotive Aftermarket and belongs to the Micro Cap category within the Auto Components & Equipments industry.<BR><BR>History: <BR>The company was incorporated in July 1954 and has maintained its status as a distributor for automobile spare parts. The latest quarterly results reported net sales and profit for June 2026.<BR><BR>Financial Snapshot: <BR>Net Sales: 234 Cr (Quarterly Results - Jun 2026) <BR>Net Profit: 22 Cr (Quarterly Results - Jun 2026) <BR>Market Cap: INR 1,370 Cr (Micro Cap)<BR><BR>Key Metrics: <BR>P/E: 17.00 <BR>Industry P/E: 21 <BR>Dividend Yield: 3.01% <BR>Debt-Equity: -0.04 <BR>Return on Equity: 3.11% <BR>Price to Book: 0.54 <BR><BR>Contact Details: <BR>Address: Sundaram Towers 3rd Floor, 46 Whites Road Chennai Tamil Nadu : 600014 <BR>Tel: 91-44-28523996 <BR>Email: secy@impal.net <BR>Website: http://www.impal.net

View full answer

Who are the peers of the India Motor Part?

01-Sep-2026

Peers of India Motor Part include NDR Auto Components, Menon Bearings, Frontier Springs, and others. Management risk is average for India Motor Part, with a 1-year return of 7.01%, lower than Menon Bearings' 126.07% but higher than NDR Auto Components' -26.88%.

Peers: The peers of India Motor Part are NDR Auto Compon., Menon Bearings, Frontier Springs, Bharat Seats, Kross Ltd, Jay Bharat Maru., Igarashi Motors, Precision Camshf, and Munjal Auto Inds.<BR><BR>Quality Snapshot: Excellent management risk is observed at NDR Auto Compon., Frontier Springs, and Menon Bearings, while Average management risk is found at Bharat Seats, India Motor Part, Kross Ltd, Jay Bharat Maru., Igarashi Motors, Precision Camshf, and Munjal Auto Inds. Growth is Excellent for NDR Auto Compon. and Frontier Springs, Good for Menon Bearings and Precision Camshf, while Average growth is seen in Bharat Seats, and the rest have Below Average growth. Capital Structure is Excellent for NDR Auto Compon., Frontier Springs, India Motor Part, Kross Ltd, while it is Good for Bharat Seats and Precision Camshf, and Average for Jay Bharat Maru. and Igarashi Motors, with the rest having Below Average.<BR><BR>Return Snapshot: Menon Bearings has the highest 1-year return at 126.07%, while NDR Auto Compon. has the lowest at -26.88%. India Motor Part's 1-year return of 7.01% is significantly lower than Menon Bearings but higher than NDR Auto Compon. Additionally, Igarashi Motors and Precision Camshf have negative six-month returns.

View full answer

How big is India Motor Part?

01-Sep-2026

As of 31st August, India Motor Parts & Accessories Ltd has a market capitalization of 1,370.00 Cr, with recent net sales of 753.23 Cr and net profit of 78.45 Cr over the last four quarters.

As of 31st August, <BR><BR>Market Cap: India Motor Parts & Accessories Ltd has a market capitalization of 1,370.00 Cr and is classified as a Micro Cap.<BR><BR>Recent Quarterly Performance: The sum of Net Sales for the latest 4 quarters is 753.23 Cr, while the sum of Net Profit for the same period is 78.45 Cr.<BR><BR>Balance Sheet Snapshot: The reporting period is March 2024, with Shareholder's Funds amounting to 2,070.17 Cr and Total Assets totaling 2,310.66 Cr.

View full answer

Should I buy, sell or hold India Motor Parts & Accessories Ltd?

31-Jul-2026

Is India Motor Part technically bullish or bearish?

28-Nov-2025

As of November 27, 2025, the market trend has shifted to sideways with mixed signals from indicators, showing no clear bullish or bearish bias.

As of 27 November 2025, the technical trend has changed from mildly bullish to sideways. The current stance is neutral, with mixed signals across different indicators. The weekly MACD is bearish, while the monthly MACD is mildly bearish, indicating a lack of upward momentum. The Bollinger Bands are bearish on the monthly and mildly bearish on the weekly, suggesting price weakness. The daily moving averages show a mildly bullish signal, but this is countered by the weekly KST being bullish and the monthly KST being mildly bearish. The Dow Theory indicates no trend on the weekly and mildly bullish on the monthly, adding to the indecisiveness. Overall, the strength of the indicators suggests a sideways movement with no clear bullish or bearish bias at this time.

View full answer

Is India Motor Part overvalued or undervalued?

29-Oct-2025

As of October 28, 2025, India Motor Part's valuation has improved to very attractive, with a PE ratio of 17.46 and a Price to Book Value of 0.54, indicating it is undervalued compared to peers like Elitecon International and MMTC, despite recent underperformance in stock returns.

As of 28 October 2025, the valuation grade for India Motor Part has moved from attractive to very attractive, indicating a positive shift in its perceived value. The company appears to be undervalued based on its current financial ratios. Key metrics include a PE ratio of 17.46, a Price to Book Value of 0.54, and an EV to EBITDA ratio of 22.13, which suggest that the stock is trading at a discount relative to its earnings and asset value.<BR><BR>In comparison to its peers, India Motor Part's PE ratio is significantly lower than that of Elitecon International, which is deemed very expensive at 357.73, and MMTC, which has a PE ratio of 141.54 and is classified as risky. Additionally, PTC India, another peer, is also very attractive with a PE of 8.16, reinforcing the notion that India Motor Part is positioned favorably within the auto components and equipment industry. Despite a recent underperformance in stock returns relative to the Sensex over the year, the company's valuation metrics suggest a compelling investment opportunity.

View full answer

How has been the historical performance of India Motor Part?

28-Oct-2025

India Motor Part has shown steady growth, with net sales increasing from 479.09 Cr in Mar'18 to 741.16 Cr in Mar'24, despite a slight decline in operating profit and profits after tax. Total assets rose significantly to 2,310.66 Cr, while cash flow from operating activities decreased to 26.00 Cr, but net cash inflow improved to 11.00 Cr.

Answer:<BR>The historical performance of India Motor Part shows a steady growth in net sales and profits over the years, with net sales increasing from 479.09 Cr in Mar'18 to 741.16 Cr in Mar'24. The total operating income followed a similar upward trend, reaching 741.16 Cr in Mar'24, up from 646.09 Cr in Mar'22. The company's total expenditure also rose, amounting to 684.25 Cr in Mar'24, which reflects an increase from 587.66 Cr in Mar'22. Operating profit, excluding other income, was 56.91 Cr in Mar'24, slightly down from 64.08 Cr in Mar'23, while the overall operating profit (PBDIT) was 92.22 Cr in Mar'24, showing a decrease from 94.65 Cr in Mar'23. Profit before tax was 91.02 Cr in Mar'24, down from 93.72 Cr in Mar'23, and profit after tax was 73.92 Cr, a slight decrease from 75.14 Cr in the previous year. The company's total assets grew significantly to 2,310.66 Cr in Mar'24 from 1,368.58 Cr in Mar'22, while total liabilities also increased to 2,310.66 Cr in Mar'24 from 1,501.87 Cr in Mar'23. Cash flow from operating activities was 26.00 Cr in Mar'24, down from 31.00 Cr in Mar'23, but the net cash inflow improved to 11.00 Cr from 2.00 Cr in the previous year.<BR><BR>Breakdown:<BR>India Motor Part has demonstrated consistent growth in its financial performance over the years, with net sales rising from 479.09 Cr in Mar'18 to 741.16 Cr in Mar'24. The total operating income mirrored this trend, reaching 741.16 Cr in Mar'24. However, total expenditure also increased, culminating in 684.25 Cr in Mar'24. Operating profit, excluding other income, decreased slightly to 56.91 Cr in Mar'24, while the overall operating profit (PBDIT) was 92.22 Cr. Profit before tax saw a minor decline to 91.02 Cr, with profit after tax at 73.92 Cr. The company's total assets surged to 2,310.66 Cr, reflecting a significant increase from previous years, while total liabilities rose correspondingly. Cash flow from operating activities was 26.00 Cr, indicating a decrease from the prior year, but the net cash inflow improved to 11.00 Cr, showcasing a positive cash position.

View full answer

How has been the historical performance of India Motor Part?

28-Oct-2025

India Motor Part has shown consistent growth in net sales and total assets, increasing from 646.09 crore in Mar'22 to 741.16 crore in Mar'24, but has experienced a decline in profit margins and operating profits recently. Profit before tax decreased from 93.72 crore in Mar'23 to 91.02 crore in Mar'24, highlighting concerns despite overall growth.

Answer:<BR>The historical performance of India Motor Part shows a consistent growth trend in net sales and profits over the years, although there has been a slight decline in profit margins recently.<BR><BR>Breakdown:<BR>India Motor Part's net sales increased from 646.09 crore in Mar'22 to 741.16 crore in Mar'24, reflecting a steady growth trajectory. The total operating income followed a similar pattern, rising from 531.53 crore in Mar'21 to 741.16 crore in Mar'24. However, the operating profit (PBDIT) saw a slight decrease from 94.65 crore in Mar'23 to 92.22 crore in Mar'24, indicating a decline in operating profit margin from 8.83% to 7.68%. Profit before tax also decreased from 93.72 crore in Mar'23 to 91.02 crore in Mar'24, while profit after tax slightly declined from 75.14 crore to 73.92 crore during the same period. The company's total assets grew significantly from 1,368.58 crore in Mar'22 to 2,310.66 crore in Mar'24, driven by an increase in reserves from 1,221.55 crore to 2,057.69 crore. Total liabilities also rose from 1,501.87 crore to 2,310.66 crore, but the company maintained a debt-free status. Cash flow from operating activities showed a decrease from 31 crore in Mar'23 to 26 crore in Mar'24, while net cash inflow improved from 2 crore to 11 crore in the same timeframe. Overall, while India Motor Part has demonstrated growth in sales and assets, the recent decline in profit margins and operating profits warrants attention.

View full answer

Are India Motor Part latest results good or bad?

30-Jul-2025

India Motor Parts & Accessories reported mixed results for Q3 2024, achieving its highest PAT and EPS in five quarters, but with over half of its PBT coming from Non-Operating Income, raising sustainability concerns. Overall, the performance is rated 2 out of 5, suggesting a cautious hold on the stock.

India Motor Parts & Accessories has delivered mixed results for the quarter ending September 2024. On the positive side, the company achieved its highest Profit After Tax (PAT) in the last five quarters, amounting to Rs 22.60 crore, and its Earnings per Share (EPS) reached Rs 18.11, also a five-quarter high. Additionally, the Dividend Payout Ratio (DPR) has increased to 45.58%, indicating a higher distribution of profits to shareholders.<BR><BR>However, there are notable concerns. The company’s Non-Operating Income constitutes 51.63% of its Profit Before Tax (PBT), which raises questions about the sustainability of its income sources. This Non-Operating Income has also reached a five-quarter high at Rs 15.05 crore, suggesting reliance on non-business activities.<BR><BR>Overall, the performance can be characterized as flat, with a score of 2 out of 5 from MarketsMOJO, which reflects a slight improvement from the previous quarter's score of 1. Given these factors, the recommendation to hold positions in the stock indicates a cautious approach, reflecting both the positive developments and the underlying concerns.

View full answer

Who are the top shareholders of the India Motor Part?

06-Jun-2025

The top shareholders of India Motor Part are Trichur Sundaram Santhanam & Family Private Limited with 21.87%, Sundaram Finance Holdings Limited with 20%, foreign institutional investors holding 7.89%, and individual investors at 32.9%. There are no pledged promoter holdings or mutual fund investments in the company.

The top shareholders of India Motor Part include Trichur Sundaram Santhanam & Family Private Limited, which holds the highest promoter stake at 21.87%. Following them is Sundaram Finance Holdings Limited, a significant public shareholder with a 20% stake. Additionally, foreign institutional investors (FIIs) collectively hold 7.89% of the company, and individual investors account for 32.9% of the total holdings. There are no pledged promoter holdings, and no mutual funds are currently invested in the company.

View full answer

When is the next results date for India Motor Part?

06-Jun-2025

No Upcoming Board Meetings

What is the bonus history of the India Motor Part?

06-Jun-2025

India Motor Parts & Accessories Ltd issued a 1:2 bonus on October 25, 2019, and a 1:1 bonus on September 10, 2012, demonstrating its commitment to rewarding shareholders with bonus shares.

India Motor Parts & Accessories Ltd has a history of issuing bonuses. The most recent bonus was a 1:2 bonus issue, which was announced with an ex-date of October 25, 2019, and a record date of October 29, 2019. Prior to that, the company issued a 1:1 bonus on September 10, 2012, with a record date of September 11, 2012. This reflects the company's approach to rewarding its shareholders through bonus shares in the past.

View full answer

Has India Motor Part declared dividend?

06-Jun-2025

Yes, India Motor Parts & Accessories Ltd has declared a 100% dividend of ₹10 per share, with an ex-date of 06 Feb 2025 and a dividend yield of 2.6%. The company has shown strong total returns over various periods, particularly in the long term.

India Motor Parts & Accessories Ltd has declared a 100% dividend.<BR><BR>Dividend Details:<BR>- Percentage announced: 100%<BR>- Amount per share: ₹10<BR>- Ex-date: 06 Feb 2025<BR><BR>Dividend Yield: 2.6%.<BR><BR>Total Returns by Period:<BR>In the 6-month period, the price return was -12.83%, the dividend return was 0.81%, resulting in a total return of -12.02%.<BR><BR>For the 1-year period, the price return was 8.95%, the dividend return was 2.77%, leading to a total return of 11.72%.<BR><BR>Over 2 years, the price return was 44.93%, the dividend return was 6.87%, culminating in a total return of 51.8%.<BR><BR>In the 3-year period, the price return was 35.71%, the dividend return was 7.83%, which resulted in a total return of 43.54%.<BR><BR>For the 4-year period, the price return was 59.95%, the dividend return was 11.01%, giving a total return of 70.96%.<BR><BR>Finally, in the 5-year period, the price return was 116.0%, the dividend return was 15.97%, resulting in a total return of 131.97%.<BR><BR>Overall, India Motor Parts & Accessories Ltd has declared a substantial dividend while also demonstrating strong total returns over various periods, particularly in the longer term. The dividend yield of 2.6% indicates a favorable return for investors in addition to price appreciation.

View full answer
iScoreScore
Click here to find our call on this stock
Strong Sell
Sell
Hold
Buy
Strong Buy

Dashboard

1

The company is Net-Debt Free

 
2

Poor long term growth as Net Sales has grown by an annual rate of 8.89% and Operating profit at 5.03% over the last 5 years

 
3

Flat results in Jun 26

4

With ROE of 3.1, it has a Very Attractive valuation with a 0.5 Price to Book Value

5

Rising Promoter Confidence

stock-summaryMojo Parameters

Mojo Parameters

Loading Valuation Snapshot...

Stock DNA

stock-summary
Industry

Auto Components & Equipments

stock-summary
Market cap

INR 1,353 Cr (Micro Cap)

stock-summary
P/E

17.00

stock-summary
Industry P/E

22

stock-summary
Dividend Yield

3.05%

stock-summary
Debt Equity

-0.04

stock-summary
Return on Equity

3.11%

stock-summary
Price to Book

0.53

Revenue and Profits:
Net Sales:
234 Cr
(Quarterly Results - Jun 2026)
Net Profit:
22 Cr
stock-summaryTotal Returns
Total Returns (Price + Dividend) stock-summary
Dividend Yield (3.05%)
TimePeriod
Price Return
Dividend Return
Total Return
3 Months
-1.45%
2.09%
0.64%
6 Months
4.23%
2.38%
6.61%
1 Year
-0.7%
3.11%
2.41%
2 Years
-21.22%
4.61%
-16.61%
3 Years
32.79%
11.54%
44.33%
4 Years
42.66%
15.28%
57.94%
5 Years
40.02%
15.76%
55.78%

Latest dividend: 23 per share ex-dividend date: Jul-14-2026

Risk Adjusted Returns v/s stock-summary
Returns Beta
Icon
Beta has not been calculated since enough price history is not available
stock-summaryNews & Corporate Actions

Announcements stock-summary

India Motor Parts and Accessories Limited - Other General Purpose

22-Nov-2019 | Source : NSE

India Motor Parts and Accessories Limited has informed the Exchange regarding Disclosure of Related Party Transaction disclosure under Regulation 23(9) of the SEBI (Listing Obligations and Disclosure Requirements) Regulations, 2015.

India Motor Parts and Accessories Limited - Press Release

14-Nov-2019 | Source : NSE

India Motor Parts and Accessories Limited has informed the Exchange regarding a press release dated November 14, 2019, titled "Unaudited standalone and consolidated financial results for the quarter and half year ended 30th September 2019".

India Motor Parts and Accessories Limited - Allotment of Securities

31-Oct-2019 | Source : NSE

India Motor Parts and Accessories Limited has informed the Exchange regarding allotment of 4160000 securities pursuant to Bonus at its meeting held on October 30, 2019

Corporate Actions stock-summary

stock-summary
BOARD MEETING

No Upcoming Board Meetings

stock-summary
DIVIDEND

India Motor Parts & Accessories Ltd has declared 230% dividend, ex-date: 14 Jul 26

stock-summary
SPLITS

No Splits history available

stock-summary
BONUS

India Motor Parts & Accessories Ltd has announced 1:2 bonus issue, ex-date: 25 Oct 19

stock-summary
RIGHTS

No Rights history available

stock-summaryKey Factors

Quality key factors stock-summary

Factor
Value
Sales Growth (5y)
8.89%
EBIT Growth (5y)
5.03%
EBIT to Interest (avg)
53.48
Debt to EBITDA (avg)
0.24
Net Debt to Equity (avg)
-0.04
Sales to Capital Employed (avg)
0.37
Tax Ratio
20.36%
Dividend Payout Ratio
44.75%
Pledged Shares
0
Institutional Holding
0.76%
ROCE (avg)
3.09%
ROE (avg)
4.27%

Valuation key factors

Factor
Value
P/E Ratio
17
Industry P/E
22
Price to Book Value
0.53
EV to EBIT
22.02
EV to EBITDA
21.56
EV to Capital Employed
0.51
EV to Sales
1.64
PEG Ratio
1.17
Dividend Yield
3.08%
ROCE (Latest)
2.32%
ROE (Latest)
3.11%

Technicals key factors

Indicator
Weekly
Monthly
MACD
Mildly Bearish
Bullish
RSI
No Signal
No Signal
Bollinger Bands
Bearish
Bullish
Moving Averages
Mildly Bullish (Daily)
KST
Mildly Bearish
Bullish
Dow Theory
Mildly Bullish
No Trend
OBV
No Trend
Mildly Bearish
stock-summary Technical Indicator Scale: Bearish, Mildly Bearish, Sideways, Mildly Bullish, Bullish  Turned 
stock-summaryShareholding
Shareholding Snapshot : Jun 2026stock-summary
Shareholding Compare (%holding) stock-summary
Majority shareholders

Non Institution

Pledged Promoter Holdings

None

Mutual Funds

Held by 0 Schemes

FIIs

Held by 2 FIIs (0.76%)

Promoter with highest holding

Trichur Sundaram Santhanam & Family Private Limited (24.97%)

Highest Public shareholder

Tsf Investments Limited (24.74%)

Individual Investors Holdings

32.76%

stock-summaryFinancial
[
  {
    "link": "quarterly",
    "btn_text": "All Quarterly Results",
    "header": "Quarterly Results Snapshot (Standalone) - Jun'26 - YoY",
    "rhs": [
      {
        "prefix": "Net Sales ",
        "suffix": "YoY Growth in quarter ended Jun 2026 is 19.12% vs -0.61% in Jun 2025",
        "dir": 1
      },
      {
        "prefix": "Standalone Net Profit ",
        "suffix": "YoY Growth in quarter ended Jun 2026 is 6.32% vs -2.06% in Jun 2025",
        "dir": 1
      }
    ],
    "table": {
      "header": [
        "Jun'26",
        "Jun'25",
        "Change(%)"
      ],
      "body": [
        {
          "field": "Net Sales",
          "val1": "234.29",
          "val2": "196.69",
          "chgp": "19.12%",
          "chgp_class": "positive"
        },
        {
          "field": "Operating Profit (PBDIT) excl Other Income",
          "val1": "18.18",
          "val2": "14.06",
          "chgp": "29.30%",
          "chgp_class": "positive"
        },
        {
          "field": "Interest",
          "val1": "0.00",
          "val2": "0.00",
          "chgp": "",
          "chgp_class": "neutral"
        },
        {
          "field": "Exceptional Items",
          "val1": "0.00",
          "val2": "0.00",
          "chgp": "",
          "chgp_class": "neutral"
        },
        {
          "field": "Standalone Net Profit",
          "val1": "21.70",
          "val2": "20.41",
          "chgp": "6.32%",
          "chgp_class": "positive"
        },
        {
          "field": "Operating Profit Margin (Excl OI)",
          "val1": "7.76%",
          "val2": "7.15%",
          "chgp": "0.61%",
          "chgp_class": "positive"
        }
      ]
    }
  },
  {
    "link": "half-yearly",
    "btn_text": "All Half Yearly Results",
    "header": "Half Yearly Results Snapshot (Standalone) - Sep'25",
    "rhs": [
      {
        "prefix": "Net Sales ",
        "suffix": " Growth in half year ended Sep 2025 is 1.83% vs 5.60% in Sep 2024",
        "dir": -1
      },
      {
        "prefix": "Standalone Net Profit ",
        "suffix": " Growth in half year ended Sep 2025 is 5.69% vs 13.45% in Sep 2024",
        "dir": -1
      }
    ],
    "table": {
      "header": [
        "Sep'25",
        "Sep'24",
        "Change(%)"
      ],
      "body": [
        {
          "field": "Net Sales",
          "val1": "395.40",
          "val2": "388.29",
          "chgp": "1.83%",
          "chgp_class": "positive"
        },
        {
          "field": "Operating Profit (PBDIT) excl Other Income",
          "val1": "28.64",
          "val2": "29.12",
          "chgp": "-1.65%",
          "chgp_class": "negative"
        },
        {
          "field": "Interest",
          "val1": "0.00",
          "val2": "0.00",
          "chgp": "",
          "chgp_class": "neutral"
        },
        {
          "field": "Exceptional Items",
          "val1": "0.00",
          "val2": "0.00",
          "chgp": "",
          "chgp_class": "neutral"
        },
        {
          "field": "Standalone Net Profit",
          "val1": "45.91",
          "val2": "43.44",
          "chgp": "5.69%",
          "chgp_class": "positive"
        },
        {
          "field": "Operating Profit Margin (Excl OI)",
          "val1": "7.24%",
          "val2": "7.50%",
          "chgp": "-0.26%",
          "chgp_class": "negative"
        }
      ]
    }
  },
  {
    "link": "nine-monthly",
    "btn_text": "All Nine Monthly Results",
    "header": "Nine Monthly Results Snapshot (Standalone) - Dec'25",
    "rhs": [
      {
        "prefix": "Net Sales ",
        "suffix": "YoY Growth in nine months ended Dec 2025 is 4.41% vs 8.28% in Dec 2024",
        "dir": -1
      },
      {
        "prefix": "Standalone Net Profit ",
        "suffix": "YoY Growth in nine months ended Dec 2025 is 5.61% vs 11.71% in Dec 2024",
        "dir": -1
      }
    ],
    "table": {
      "header": [
        "Dec'25",
        "Dec'24",
        "Change(%)"
      ],
      "body": [
        {
          "field": "Net Sales",
          "val1": "626.39",
          "val2": "599.96",
          "chgp": "4.41%",
          "chgp_class": "positive"
        },
        {
          "field": "Operating Profit (PBDIT) excl Other Income",
          "val1": "46.41",
          "val2": "45.55",
          "chgp": "1.89%",
          "chgp_class": "positive"
        },
        {
          "field": "Interest",
          "val1": "0.00",
          "val2": "0.00",
          "chgp": "",
          "chgp_class": "neutral"
        },
        {
          "field": "Exceptional Items",
          "val1": "0.00",
          "val2": "0.00",
          "chgp": "",
          "chgp_class": "neutral"
        },
        {
          "field": "Standalone Net Profit",
          "val1": "63.09",
          "val2": "59.74",
          "chgp": "5.61%",
          "chgp_class": "positive"
        },
        {
          "field": "Operating Profit Margin (Excl OI)",
          "val1": "7.41%",
          "val2": "7.59%",
          "chgp": "-0.18%",
          "chgp_class": "negative"
        }
      ]
    }
  },
  {
    "link": "annual",
    "btn_text": "All Annual Results",
    "header": "Annual Results Snapshot (Standalone) - Mar'26",
    "rhs": [
      {
        "prefix": "Net Sales ",
        "suffix": "YoY Growth in year ended Mar 2026 is 6.12% vs 6.43% in Mar 2025",
        "dir": -1
      },
      {
        "prefix": "Standalone Net Profit ",
        "suffix": "YoY Growth in year ended Mar 2026 is 15.39% vs 13.19% in Mar 2025",
        "dir": 1
      }
    ],
    "table": {
      "header": [
        "Mar'26",
        "Mar'25",
        "Change(%)"
      ],
      "body": [
        {
          "field": "Net Sales",
          "val1": "837.11",
          "val2": "788.81",
          "chgp": "6.12%",
          "chgp_class": "positive"
        },
        {
          "field": "Operating Profit (PBDIT) excl Other Income",
          "val1": "63.55",
          "val2": "61.58",
          "chgp": "3.20%",
          "chgp_class": "positive"
        },
        {
          "field": "Interest",
          "val1": "0.00",
          "val2": "0.00",
          "chgp": "",
          "chgp_class": "neutral"
        },
        {
          "field": "Exceptional Items",
          "val1": "0.00",
          "val2": "-2.67",
          "chgp": "100.00%",
          "chgp_class": "positive"
        },
        {
          "field": "Standalone Net Profit",
          "val1": "96.55",
          "val2": "83.67",
          "chgp": "15.39%",
          "chgp_class": "positive"
        },
        {
          "field": "Operating Profit Margin (Excl OI)",
          "val1": "7.59%",
          "val2": "7.81%",
          "chgp": "-0.22%",
          "chgp_class": "negative"
        }
      ]
    }
  }
]

Quarterly Results Snapshot (Standalone) - Jun'26 - YoYstock-summary

Jun'26
Jun'25
Change(%)
Net Sales
234.29
196.69
19.12%
Operating Profit (PBDIT) excl Other Income
18.18
14.06
29.30%
Interest
0.00
0.00
Exceptional Items
0.00
0.00
Standalone Net Profit
21.70
20.41
6.32%
Operating Profit Margin (Excl OI)
7.76%
7.15%
0.61%
Values in Rs Cr.
Direction Arrows
Net Sales

YoY Growth in quarter ended Jun 2026 is 19.12% vs -0.61% in Jun 2025

Direction Arrows
Standalone Net Profit

YoY Growth in quarter ended Jun 2026 is 6.32% vs -2.06% in Jun 2025

Half Yearly Results Snapshot (Standalone) - Sep'25stock-summary

Sep'25
Sep'24
Change(%)
Net Sales
395.40
388.29
1.83%
Operating Profit (PBDIT) excl Other Income
28.64
29.12
-1.65%
Interest
0.00
0.00
Exceptional Items
0.00
0.00
Standalone Net Profit
45.91
43.44
5.69%
Operating Profit Margin (Excl OI)
7.24%
7.50%
-0.26%
Values in Rs Cr.
Direction Arrows
Net Sales

Growth in half year ended Sep 2025 is 1.83% vs 5.60% in Sep 2024

Direction Arrows
Standalone Net Profit

Growth in half year ended Sep 2025 is 5.69% vs 13.45% in Sep 2024

Nine Monthly Results Snapshot (Standalone) - Dec'25stock-summary

Dec'25
Dec'24
Change(%)
Net Sales
626.39
599.96
4.41%
Operating Profit (PBDIT) excl Other Income
46.41
45.55
1.89%
Interest
0.00
0.00
Exceptional Items
0.00
0.00
Standalone Net Profit
63.09
59.74
5.61%
Operating Profit Margin (Excl OI)
7.41%
7.59%
-0.18%
Values in Rs Cr.
Direction Arrows
Net Sales

YoY Growth in nine months ended Dec 2025 is 4.41% vs 8.28% in Dec 2024

Direction Arrows
Standalone Net Profit

YoY Growth in nine months ended Dec 2025 is 5.61% vs 11.71% in Dec 2024

Annual Results Snapshot (Standalone) - Mar'26stock-summary

Mar'26
Mar'25
Change(%)
Net Sales
837.11
788.81
6.12%
Operating Profit (PBDIT) excl Other Income
63.55
61.58
3.20%
Interest
0.00
0.00
Exceptional Items
0.00
-2.67
100.00%
Standalone Net Profit
96.55
83.67
15.39%
Operating Profit Margin (Excl OI)
7.59%
7.81%
-0.22%
Values in Rs Cr.
Direction Arrows
Net Sales

YoY Growth in year ended Mar 2026 is 6.12% vs 6.43% in Mar 2025

Direction Arrows
Standalone Net Profit

YoY Growth in year ended Mar 2026 is 15.39% vs 13.19% in Mar 2025

stock-summaryCompany CV
About India Motor Parts & Accessories Ltd stock-summary
stock-summary
India Motor Parts & Accessories Ltd
Micro Cap
Auto Components & Equipments
Indian Motor Parts & Accessories Limited (IMPAL) was incorporated in July, 1954 as a distributor for automobile spare parts in the Indian Automotive Aftermarket. The Company is a part of the TSF Group and operate through a network of 99 branches IMPAL is one of the few all India distributors of motar parts and deals in engine group components, brake systems, fasteners, radiators, axles, suspensions, auto electricals, wheels, steering linkages, instruments clusters etc.
Company Coordinates stock-summary
Company Details
Sundaram Towers 3rd Floor, 46 Whites Road Chennai Tamil Nadu : 600014
stock-summary
Tel: 91-44-28523996
stock-summary
secy@impal.net
Registrar Details
Cameo Corporate Services Ltd , Subramanian Buildings No 1 , Club House Road, Chennai