
Compare I T D C with Similar Stocks
Dashboard
Flat results in Mar 26
- NET SALES(Q) At Rs 142.01 cr has Fallen at -28.97%
- PBT LESS OI(Q) At Rs 28.12 cr has Fallen at -7.47%
With ROE of 19.6, it has a Very Expensive valuation with a 12.1 Price to Book Value
Despite the size of the company, domestic mutual funds hold only 0% of the company
Stock DNA
Hotels & Resorts
INR 5,281 Cr (Small Cap)
62.00
35
0.49%
-0.64
19.64%
12.11
Total Returns (Price + Dividend) 
Latest dividend: 2.9 per share ex-dividend date: Sep-09-2025
Risk Adjusted Returns v/s
Returns Beta

News
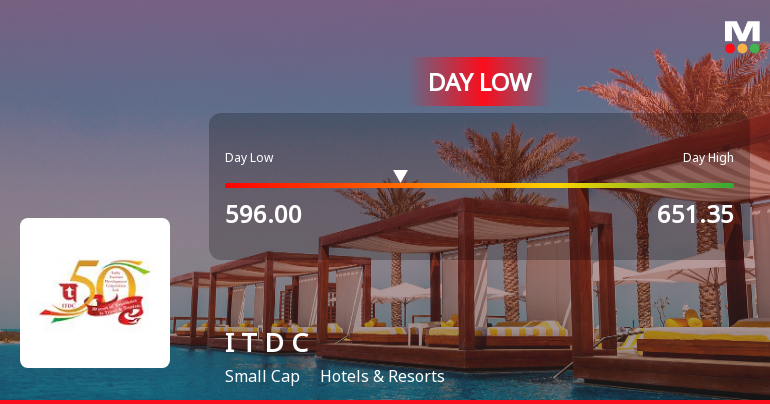
India Tourism Development Corporation Ltd Hits Intraday Low Amid Price Pressure
India Tourism Development Corporation Ltd (ITDC) experienced a notable decline today, touching an intraday low of Rs 596, reflecting significant price pressure amid broader market weakness and sectoral underperformance.
Read full news article
India Tourism Development Corporation Ltd is Rated Sell
India Tourism Development Corporation Ltd is rated 'Sell' by MarketsMOJO, with this rating last updated on 09 Feb 2026. However, the analysis and financial metrics discussed here reflect the stock's current position as of 08 June 2026, providing investors with an up-to-date view of the company’s fundamentals, valuation, financial trends, and technical outlook.
Read full news article
India Tourism Development Corporation Ltd Surges 8.4% to Day's High of Rs 589.05 — Outperforms Sector by 9.27 Percentage Points
The Sensex declined by 0.25% on 4 Jun 2026, while India Tourism Development Corporation Ltd surged 8.4%, marking a remarkable 9.27-percentage-point outperformance over its Hotels & Resorts sector. This sharp single-session gain rewrites the short-term narrative for the stock, which has been navigating a mixed performance trajectory in recent months.
Read full news article Announcements
Compliances-Reg.24(A)-Annual Secretarial Compliance
29-May-2026 | Source : BSERevised Annual Secretarial Compliance Report for the Financial year ended 31.03.2026 since cover letter was missing from the original filing
Compliances-Reg.24(A)-Annual Secretarial Compliance
29-May-2026 | Source : BSEAnnual Secretarial Compliance Report for year ended 31st March 2026
Appointment Of Non-Official Director
26-May-2026 | Source : BSEAnnouncement under Regulation 30 regarding appointment of Non Official Director on the Board of the Company
Corporate Actions

No Upcoming Board Meetings

India Tourism Development Corporation Ltd has declared 29% dividend, ex-date: 09 Sep 25

No Splits history available

No Bonus history available

No Rights history available
Quality key factors
Valuation key factors
Technicals key factors
 Technical Indicator Scale: Bearish, Mildly Bearish, Sideways, Mildly Bullish, Bullish Turned
 Shareholding Snapshot : Mar 2026
Shareholding Compare (%holding)
Promoters
None
Held by 1 Schemes (0.0%)
Held by 4 FIIs (0.02%)
The President Of India (87.03%)
The Indian Hotels Company Limited (7.87%)
2.93%
Quarterly Results Snapshot (Consolidated) - Mar'26 - YoY

YoY Growth in quarter ended Mar 2026 is -28.97% vs 41.75% in Mar 2025
YoY Growth in quarter ended Mar 2026 is 12.66% vs 151.60% in Mar 2025
Half Yearly Results Snapshot (Consolidated) - Sep'25
Growth in half year ended Sep 2025 is -9.17% vs -8.88% in Sep 2024
Growth in half year ended Sep 2025 is -26.00% vs -2.65% in Sep 2024
Nine Monthly Results Snapshot (Consolidated) - Dec'25

YoY Growth in nine months ended Dec 2025 is 5.51% vs -3.52% in Dec 2024
YoY Growth in nine months ended Dec 2025 is -3.49% vs 3.24% in Dec 2024
Annual Results Snapshot (Consolidated) - Mar'26
YoY Growth in year ended Mar 2026 is -6.64% vs 12.20% in Mar 2025
YoY Growth in year ended Mar 2026 is 2.87% vs 24.46% in Mar 2025
About India Tourism Development Corporation Ltd

Company Coordinates


