Indiabulls

  • Market Cap: Small Cap
  • Industry: Diversified Commercial Services
  • ISIN: INE126M01010
  • NSEID: IBULLSLTD
  • BSEID: 533520
INR
26.89
1.28 (5.0%)
BSENSE

Aug 24, 03:30 PM

BSE+NSE Vol: 1.01 cr

  • Price Points
  • Score
  • Mojo Parameters
  • Total Return
  • News and Corporate Actions
  • Key factors
  • Shareholding
  • Financials
  • CompanyCV
stock-summaryPrice Point
High/Low

1Day

52 Week

Valuation
Technical
Day's Volume

CASH

1.01 cr (-28.89%) Volume

Shareholding (Jun 2026)

FII

17.08%

Held by 28 FIIs

DII

0.11%

Held by 40 DIIs

Promoter

32.91%

Why is Indiabulls Limited falling/rising?

25-Aug-2026

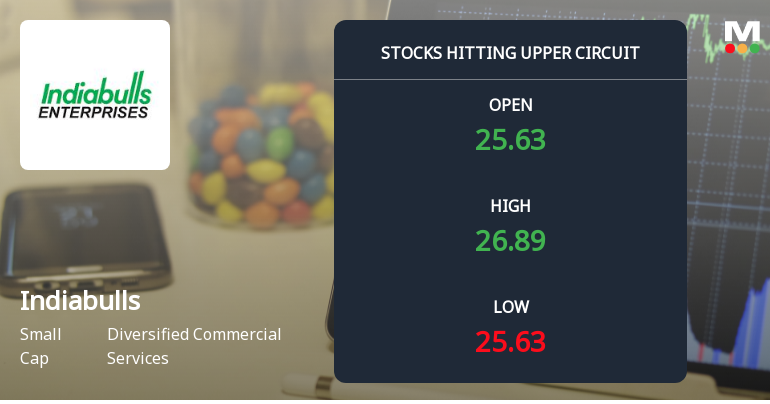
As of 24-Aug, Indiabulls Limited's stock price is rising to Rs 26.89, reflecting a 5.0% increase after a trend reversal. Despite recent declines, the stock has strong long-term performance and positive financial results, indicating a healthy outlook.

As of 24-Aug, Indiabulls Limited's stock price is rising, currently at Rs 26.89, reflecting an increase of 1.28 or 5.0%. This upward movement follows a trend reversal after four consecutive days of decline, indicating a potential shift in market sentiment. The stock has outperformed its sector by 5.47% today, suggesting positive investor interest.<BR><BR>Despite a recent decline of 3.41% over the past week and a more significant drop of 12.32% over the last month, the stock has shown strong long-term performance, with a year-to-date increase of 55.88% and a 60.06% rise over the past year. The company has consistently reported positive results, including a remarkable growth in operating profit of 122.64% and a net sales increase to Rs 767.98 crore over the last six months. These factors contribute to a healthy outlook for the company, supported by a low debt-to-equity ratio of 0.03 times.<BR><BR>Additionally, the stock's current price is above its 5-day, 100-day, and 200-day moving averages, although it remains below its 20-day and 50-day moving averages. This positioning indicates a potential for continued upward momentum. However, it is important to note that there has been a decrease in investor participation, with delivery volume falling by 39.54% against the 5-day average, which could impact future price movements. Overall, the combination of strong financial performance and today's positive price action suggests that the stock is currently on the rise.

View full answer

Should I buy, sell or hold Indiabulls Limited?

15-Aug-2026

Who are in the management team of Indiabulls?

14-Aug-2026

The management team of Indiabulls includes Kubeir Khera (Executive Director & CEO) and eight independent directors: Gurrappa Gopalakrishna, Gyan Sudha Misra, Praveen Kumar Tripathi, Supriya Bhatnagar, Prem Prakash Mirdha, Aishwarya Katoch, and Gurinder Singh, ensuring strong governance and strategic direction.

The management team of Indiabulls includes the following individuals:<BR><BR>1. Gurrappa Gopalakrishna - Independent Director<BR>2. Gyan Sudha Misra - Independent Director<BR>3. Praveen Kumar Tripathi - Independent Director<BR>4. Kubeir Khera - Executive Director & CEO<BR>5. Supriya Bhatnagar - Independent Director<BR>6. Prem Prakash Mirdha - Independent Director<BR>7. Aishwarya Katoch - Independent Director<BR>8. Gurinder Singh - Independent Director<BR><BR>This team comprises a mix of independent directors and the executive director, contributing to the company's governance and strategic direction.

View full answer

What does Indiabulls do?

14-Aug-2026

Indiabulls Limited is a small-cap company in the diversified commercial services sector, reporting net sales of ₹359 Cr and a net profit of ₹143 Cr for June 2026. It was incorporated in 2007 and has a market cap of ₹6,262 Cr, with a P/E ratio of 13.00.

Overview:<BR>Indiabulls Limited operates in the diversified commercial services sector and is categorized as a small-cap company.<BR><BR>History:<BR>Indiabulls Limited was initially incorporated as 'SORIL Holdings and Ventures Limited' in 2007. The company changed its name to 'Indiabulls Integrated Services Limited' on May 16, 2018. The latest quarterly results reported net sales and net profit for June 2026.<BR><BR>Financial Snapshot:<BR>- Net Sales: 359 Cr (Quarterly Results - Jun 2026)<BR>- Net Profit: 143 Cr (Quarterly Results - Jun 2026)<BR>- Market Cap: INR 6,262 Cr (Small Cap)<BR><BR>Key Metrics:<BR>- P/E: 13.00<BR>- Industry P/E: 21<BR>- Dividend Yield: 0.00%<BR>- Debt Equity: -0.13<BR>- Return on Equity: 11.07%<BR>- Price to Book: 2.04<BR><BR>Contact Details:<BR>Address: Plot No 448-451 Udyog Vihar, Phase-V Gurugram Haryana : 122016<BR>Email: helpdesk@indiabulls.com<BR>Website: http://www.indiabulls.com/wholesale

View full answer

Who are the peers of the Indiabulls?

14-Aug-2026

Indiabulls' peers include International Ge, NESCO, SIS, Nirlon, Smartworks Cowor, Quess Corp, CMS Info Systems, Indiqube Spaces, and Hemisphere Prop. Indiabulls shows excellent growth and management risk, with a 1-year return of 61.14%, while CMS Info Systems has the lowest return at -39.08%.

Peers: The peers of Indiabulls are International Ge, NESCO, SIS, Nirlon, Smartworks Cowor, Quess Corp, CMS Info Systems, Indiqube Spaces, and Hemisphere Prop.<BR><BR>Quality Snapshot: Excellent management risk is observed at International Ge, while Good management risk is found at Smartworks Cowor, Quess Corp, and CMS Info Systems. Average management risk is noted at NESCO, SIS, and Nirlon, and Below Average management risk is seen at Indiabulls and Hemisphere Prop. Indiqube Spaces does not qualify for a management risk rating. Growth is Excellent at Indiabulls and Smartworks Cowor, Average at International Ge, NESCO, Nirlon, and SIS, and Below Average at Quess Corp, CMS Info Systems, and Hemisphere Prop. Indiqube Spaces does not qualify for a growth rating. Capital Structure is Excellent at International Ge and CMS Info Systems, Good at Indiabulls and Quess Corp, Average at NESCO, SIS, and Smartworks Cowor, and Below Average at Nirlon and Hemisphere Prop, with Indiqube Spaces not qualifying.<BR><BR>Return Snapshot: Indiabulls has a 1-year return of 61.14%, while the highest 1-year return is from Indiabulls at 61.14% and the lowest is from CMS Info Systems at -39.08%. Additionally, CMS Info Systems and Hemisphere Prop have negative six-month returns.

View full answer

How big is Indiabulls?

14-Aug-2026

As of 14th August, Indiabulls Limited has a market capitalization of 6,310.73 Cr, with recent net sales of 1,101.21 Cr and a net profit of 419.07 Cr over the last four quarters.

As of 14th August, <BR><BR>Market Cap: Indiabulls Limited has a market capitalization of 6,310.73 Cr, categorizing it as a Small Cap company.<BR><BR>Recent Quarterly Performance: The sum of Net Sales for the latest 4 quarters is 1,101.21 Cr, while the sum of Net Profit for the same period is 419.07 Cr.<BR><BR>Balance Sheet Snapshot: The reporting period for the balance sheet is March 2025. Shareholder's Funds are recorded at a loss of 276.42 Cr, and Total Assets amount to 23.79 Cr.

View full answer

Are Indiabulls Limited latest results good or bad?

24-Jul-2026

Indiabulls Limited's latest Q1 FY27 results show impressive year-on-year growth, with a net profit increase of 35,647.50% and net sales up 292.33%. However, sequential declines in profit and sales raise concerns about sustainability, suggesting cautious optimism for investors.

Indiabulls Limited's latest results for Q1 FY27 can be characterized as a significant improvement compared to previous periods, particularly when looking at year-on-year growth. The company reported a net profit of ₹142.99 crores, which is an astonishing increase of 35,647.50% compared to the same quarter last year. Additionally, net sales grew by 292.33% year-on-year, reaching ₹359.45 crores.<BR><BR>However, there are some concerns regarding sequential performance. The net profit decreased by 27.05% from the previous quarter, and net sales also fell by 12.01%. This volatility in quarterly results raises questions about the sustainability of the company's recent performance.<BR><BR>On the positive side, the operating margin has improved significantly to 48.33%, up from 14.79% in the same quarter last year, indicating better operational efficiency. The return on equity (ROE) has also improved to 11.07%, suggesting enhanced capital efficiency.<BR><BR>Overall, while the year-on-year results are impressive and indicate a strong turnaround from previous financial distress, the sequential declines and revenue volatility suggest that investors should approach with cautious optimism. The company has made notable progress, but the sustainability of this turnaround remains to be seen.

View full answer

When is the next results date for Indiabulls Limited?

21-Jul-2026

Indiabulls Limited will announce its results on 23 July 2026.

Indiabulls Limited is scheduled to declare its results on 23 July 2026.

View full answer

Is Indiabulls technically bullish or bearish?

03-Dec-2025

As of December 2, 2025, Indiabulls shows a mildly bullish trend supported by bullish MACD and KST indicators, though a bearish RSI and mixed Dow Theory readings suggest some caution.

As of 2 December 2025, the technical trend for Indiabulls has changed from bullish to mildly bullish. The current stance is mildly bullish, driven primarily by the weekly MACD and KST indicators, both of which are bullish. However, the weekly RSI is bearish, indicating some weakness in momentum. The moving averages are also mildly bullish on the daily timeframe, while the Dow Theory presents a mixed view with a mildly bearish signal on the weekly and mildly bullish on the monthly. Overall, the strength of the bullish signal is tempered by the bearish RSI and mixed Dow Theory readings.

View full answer

Is Indiabulls overvalued or undervalued?

20-Nov-2025

As of November 19, 2025, Indiabulls is considered very expensive and overvalued with a PE ratio of 274.90, significantly higher than its peers, despite a 50.97% return over the past year.

As of 19 November 2025, the valuation grade for Indiabulls has moved from risky to very expensive, indicating a significant shift in its perceived value. The company is currently considered overvalued, with a PE ratio of 274.90, an EV to EBITDA ratio of 41.08, and a PEG ratio of 2.67. These ratios suggest that the stock is trading at a premium compared to its earnings and growth potential.<BR><BR>In comparison to its peers, Indiabulls' valuation stands out as excessively high; for instance, Elitecon International has a PE ratio of 265.80, while PTC India, deemed very attractive, has a PE ratio of just 7.50. This stark contrast highlights the overvaluation of Indiabulls within its industry. Additionally, while the stock has shown a 50.97% return over the past year, this performance does not justify its current valuation metrics, reinforcing the conclusion that Indiabulls is overvalued.

View full answer

How has been the historical performance of Yaari Digital?

31-Oct-2025

Yaari Digital has experienced a significant decline in net sales and profitability, with net sales dropping from 225.47 crore in March 2020 to 0.00 crore by March 2025, resulting in consistent losses and negative operating profit since March 2020. Total liabilities have decreased, but the overall financial performance indicates a challenging period with increasing losses.

Answer:<BR>The historical performance of Yaari Digital shows a significant decline in net sales and profitability over the years, culminating in a net loss in recent periods.<BR><BR>Breakdown:<BR>Yaari Digital's net sales have drastically decreased from 225.47 crore in March 2020 to 0.00 crore by March 2025, reflecting a continuous downward trend. The total operating income also followed this decline, dropping from 160.55 crore in March 2022 to 0.00 crore in March 2025. The company's total expenditure, excluding depreciation, peaked at 452.99 crore in March 2020 but has since decreased to 8.21 crore in March 2025. Operating profit has been negative since March 2020, with the most recent figure at -8.21 crore in March 2025. Profit before tax has similarly deteriorated, moving from a profit of 108.44 crore in March 2019 to a loss of 68.19 crore in March 2025. The profit after tax has also shown a negative trend, with a loss of 68.20 crore in March 2025 compared to a profit of 94.85 crore in March 2023. The company's total liabilities have decreased significantly from 1,683.93 crore in March 2020 to 23.79 crore in March 2025. Cash flow from operating activities has fluctuated, with a positive cash flow of 5.00 crore in March 2025, contrasting with the negative cash flows in previous years. Overall, Yaari Digital's financial performance reflects a challenging period marked by declining revenues and increasing losses.

View full answer

Who are the top shareholders of the Yaari Digital?

06-Jun-2025

The top shareholders of Yaari Digital include Kritikka Infrastructure Private Limited with 8.52%, Rishikesh Parthasarathi at 3.03%, and individual investors holding 55.23%. There are no pledged promoter holdings or mutual fund schemes, and four foreign institutional investors hold 0.5% of the shares.

The top shareholders of Yaari Digital include Kritikka Infrastructure Private Limited, which holds the highest promoter stake at 8.52%. Additionally, Rishikesh Parthasarathi is the highest public shareholder with a holding of 3.03%. Overall, individual investors collectively hold a significant portion of 55.23%. The company also has four foreign institutional investors (FIIs) that account for 0.5% of the shares. Notably, there are no pledged promoter holdings or mutual fund schemes involved.

View full answer

Has Yaari Digital declared dividend?

06-Jun-2025

Yes, Yaari Digital declared a dividend of 50% (₹1 per share) on May 11, 2018, but the current dividend yield is 0%. Total returns have varied significantly over different periods, with both positive and negative performance.

Yaari Digital has declared a dividend.<BR><BR>Dividend Details:<BR>- Percentage announced: 50%<BR>- Amount per share: 1<BR>- Ex-date: May 11, 2018<BR><BR>Dividend Yield: 0%<BR><BR>Total Returns by Period:<BR>In the 6-month period, the price return was -11.6%, the dividend return was 0%, resulting in a total return of -11.6%.<BR><BR>In the 1-year period, the price return was 50.94%, the dividend return was 0%, resulting in a total return of 50.94%.<BR><BR>In the 2-year period, the price return was 15.94%, the dividend return was 0%, resulting in a total return of 15.94%.<BR><BR>In the 3-year period, the price return was -46.66%, the dividend return was 0%, resulting in a total return of -46.66%.<BR><BR>In the 4-year period, the price return was -85.55%, the dividend return was 0%, resulting in a total return of -85.55%.<BR><BR>In the 5-year period, the price return was -49.66%, the dividend return was 0%, resulting in a total return of -49.66%.<BR><BR>Overall, while Yaari Digital declared a dividend in the past, the current dividend yield is 0%. The total returns over various periods show significant volatility, with both positive and negative returns, indicating a mixed performance in the company's stock value.

View full answer
iScoreScore
Part of MojoOne Strategy
Click here to find our call on this stock
Strong Sell
Sell
Hold
Buy
Strong Buy

Dashboard

1

Poor Management Efficiency with a low ROE of 2.77%

  • The company has been able to generate a Return on Equity (avg) of 2.77% signifying low profitability per unit of shareholders funds
2

Company has a Debt to Equity ratio (avg) of 0.03 times

 
3

Healthy long term growth as Net Sales has grown by an annual rate of 47.53% and Operating profit at 58.86%

 
4

With a growth in Operating Profit of 122.64%, the company declared Outstanding results in Jun 26

5

With ROE of 11.1, it has a Very Expensive valuation with a 2 Price to Book Value

stock-summaryMojo Parameters

Mojo Parameters

Loading Valuation Snapshot...

Stock DNA

stock-summary
Industry

Diversified Commercial Services

stock-summary
Market cap

INR 6,075 Cr (Small Cap)

stock-summary
P/E

13.00

stock-summary
Industry P/E

21

stock-summary
Dividend Yield

0.00%

stock-summary
Debt Equity

-0.13

stock-summary
Return on Equity

11.07%

stock-summary
Price to Book

1.94

Revenue and Profits:
Net Sales:
359 Cr
(Quarterly Results - Jun 2026)
Net Profit:
143 Cr
stock-summaryTotal Returns
Total Returns (Price + Dividend) stock-summary
Dividend Yield (0%)
TimePeriod
Price Return
Dividend Return
Total Return
3 Months
40.71%
0%
40.71%
6 Months
196.15%
0%
196.15%
1 Year
60.06%
0%
60.06%
2 Years
153.44%
0%
153.44%
3 Years
147.38%
0%
147.38%
4 Years
-38.78%
0%
-38.78%
5 Years
-60.1%
0%
-60.1%

Latest dividend: 0.7356634198248342 per share ex-dividend date: May-11-2018

Risk Adjusted Returns v/s stock-summary
Returns Beta
Icon
Beta has not been calculated since enough price history is not available
stock-summaryNews & Corporate Actions

News

Announcements stock-summary

Announcement under Regulation 30 (LODR)-Allotment

19-Aug-2026 | Source : BSE

Please find attached intimation of allotment of fully paid-up equity shares pursuant to exercise of employee stock options under Indiabulls Limited Employee Stock Option Scheme-2025.

Update On Hearing In PIL Against Promoter

19-Aug-2026 | Source : BSE

Please find attached Update on hearing in PIL against Promoter.

Clarification To Stock Exchanges On In-Principle Application For Preferential Issue Of The Company

03-Aug-2026 | Source : BSE

Please find attached Clarification to Stock Exchanges on In-principle Application for Preferential Issue of the Company.

Corporate Actions stock-summary

stock-summary
BOARD MEETING

No Upcoming Board Meetings

stock-summary
DIVIDEND

Indiabulls Limited has declared 50% dividend, ex-date: 11 May 18

stock-summary
SPLITS

No Splits history available

stock-summary
BONUS

No Bonus history available

stock-summary
RIGHTS

No Rights history available

stock-summaryKey Factors

Quality key factors stock-summary

Factor
Value
Sales Growth (5y)
47.53%
EBIT Growth (5y)
58.86%
EBIT to Interest (avg)
0.51
Debt to EBITDA (avg)
Negative Net Debt
Net Debt to Equity (avg)
-0.13
Sales to Capital Employed (avg)
0.69
Tax Ratio
Tax Ratio is Negative%
Dividend Payout Ratio
0
Pledged Shares
0
Institutional Holding
17.19%
ROCE (avg)
-28.57%
ROE (avg)
2.77%

Valuation key factors

Factor
Value
P/E Ratio
13
Industry P/E
21
Price to Book Value
2.03
EV to EBIT
15.35
EV to EBITDA
14.04
EV to Capital Employed
2.19
EV to Sales
5.32
PEG Ratio
0.12
Dividend Yield
NA
ROCE (Latest)
8.97%
ROE (Latest)
11.07%

Technicals key factors

Indicator
Weekly
Monthly
MACD
Mildly Bearish
Bullish
RSI
No Signal
No Signal
Bollinger Bands
Bullish
Mildly Bullish
Moving Averages
Mildly Bullish (Daily)
KST
Mildly Bearish
Bullish
Dow Theory
No Trend
No Trend
OBV
No Trend
Bullish
stock-summary Technical Indicator Scale: Bearish, Mildly Bearish, Sideways, Mildly Bullish, Bullish  Turned 
stock-summaryShareholding
Shareholding Snapshot : Jun 2026stock-summary
Shareholding Compare (%holding) stock-summary
Majority shareholders

Non Institution

Pledged Promoter Holdings

None

Mutual Funds

Held by 0 Schemes

FIIs

Held by 28 FIIs (17.08%)

Promoter with highest holding

Inuus Developers Private Limited (19.68%)

Highest Public shareholder

Acm Global Fund Vcc (4.91%)

Individual Investors Holdings

30.45%

stock-summaryFinancial
[
  {
    "link": "quarterly",
    "btn_text": "All Quarterly Results",
    "header": "Quarterly Results Snapshot (Consolidated) - Jun'26 - QoQ",
    "rhs": [
      {
        "prefix": "Net Sales ",
        "suffix": "QoQ Growth in quarter ended Jun 2026 is -12.01% vs 321.34% in Mar 2026",
        "dir": -1
      },
      {
        "prefix": "Consolidated Net Profit ",
        "suffix": "QoQ Growth in quarter ended Jun 2026 is -27.05% vs 146.94% in Mar 2026",
        "dir": -1
      }
    ],
    "table": {
      "header": [
        "Jun'26",
        "Mar'26",
        "Change(%)"
      ],
      "body": [
        {
          "field": "Net Sales",
          "val1": "359.45",
          "val2": "408.53",
          "chgp": "-12.01%",
          "chgp_class": "negative"
        },
        {
          "field": "Operating Profit (PBDIT) excl Other Income",
          "val1": "153.93",
          "val2": "170.06",
          "chgp": "-9.48%",
          "chgp_class": "negative"
        },
        {
          "field": "Interest",
          "val1": "9.64",
          "val2": "9.93",
          "chgp": "-2.92%",
          "chgp_class": "positive"
        },
        {
          "field": "Exceptional Items",
          "val1": "0.00",
          "val2": "-64.86",
          "chgp": "100.00%",
          "chgp_class": "positive"
        },
        {
          "field": "Consolidate Net Profit",
          "val1": "142.99",
          "val2": "196.00",
          "chgp": "-27.05%",
          "chgp_class": "negative"
        },
        {
          "field": "Operating Profit Margin (Excl OI)",
          "val1": "48.33%",
          "val2": "41.63%",
          "chgp": "6.70%",
          "chgp_class": "positive"
        }
      ]
    }
  },
  {
    "link": "half-yearly",
    "btn_text": "All Half Yearly Results",
    "header": "Half Yearly Results Snapshot (Consolidated) - Sep'25",
    "rhs": [
      {
        "prefix": "Net Sales ",
        "suffix": " Growth in half year ended Sep 2025 is 38.72% vs 98,383.33% in Sep 2024",
        "dir": -1
      },
      {
        "prefix": "Consolidated Net Profit ",
        "suffix": " Growth in half year ended Sep 2025 is 98.39% vs -726.60% in Sep 2024",
        "dir": 1
      }
    ],
    "table": {
      "header": [
        "Sep'25",
        "Sep'24",
        "Change(%)"
      ],
      "body": [
        {
          "field": "Net Sales",
          "val1": "327.89",
          "val2": "236.36",
          "chgp": "38.72%",
          "chgp_class": "positive"
        },
        {
          "field": "Operating Profit (PBDIT) excl Other Income",
          "val1": "120.73",
          "val2": "-46.38",
          "chgp": "360.31%",
          "chgp_class": "positive"
        },
        {
          "field": "Interest",
          "val1": "23.18",
          "val2": "44.90",
          "chgp": "-48.37%",
          "chgp_class": "positive"
        },
        {
          "field": "Exceptional Items",
          "val1": "0.00",
          "val2": "0.00",
          "chgp": "",
          "chgp_class": "neutral"
        },
        {
          "field": "Consolidate Net Profit",
          "val1": "-1.50",
          "val2": "-92.91",
          "chgp": "98.39%",
          "chgp_class": "positive"
        },
        {
          "field": "Operating Profit Margin (Excl OI)",
          "val1": "36.82%",
          "val2": "-19.62%",
          "chgp": "56.44%",
          "chgp_class": "positive"
        }
      ]
    }
  },
  {
    "link": "nine-monthly",
    "btn_text": "All Nine Monthly Results",
    "header": "Nine Monthly Results Snapshot (Consolidated) - Dec'25",
    "rhs": [
      {
        "prefix": "Net Sales ",
        "suffix": "YoY Growth in nine months ended Dec 2025 is 23.94% vs 17,13,850.00% in Dec 2024",
        "dir": -1
      },
      {
        "prefix": "Consolidated Net Profit ",
        "suffix": "YoY Growth in nine months ended Dec 2025 is 180.61% vs -547.89% in Dec 2024",
        "dir": 1
      }
    ],
    "table": {
      "header": [
        "Dec'25",
        "Dec'24",
        "Change(%)"
      ],
      "body": [
        {
          "field": "Net Sales",
          "val1": "424.85",
          "val2": "342.79",
          "chgp": "23.94%",
          "chgp_class": "positive"
        },
        {
          "field": "Operating Profit (PBDIT) excl Other Income",
          "val1": "106.50",
          "val2": "-22.07",
          "chgp": "582.56%",
          "chgp_class": "positive"
        },
        {
          "field": "Interest",
          "val1": "33.25",
          "val2": "51.69",
          "chgp": "-35.67%",
          "chgp_class": "positive"
        },
        {
          "field": "Exceptional Items",
          "val1": "0.00",
          "val2": "0.00",
          "chgp": "",
          "chgp_class": "neutral"
        },
        {
          "field": "Consolidate Net Profit",
          "val1": "77.87",
          "val2": "-96.60",
          "chgp": "180.61%",
          "chgp_class": "positive"
        },
        {
          "field": "Operating Profit Margin (Excl OI)",
          "val1": "25.07%",
          "val2": "-6.44%",
          "chgp": "31.51%",
          "chgp_class": "positive"
        }
      ]
    }
  },
  {
    "link": "annual",
    "btn_text": "All Annual Results",
    "header": "Annual Results Snapshot (Consolidated) - Mar'26",
    "rhs": [
      {
        "prefix": "Net Sales ",
        "suffix": "YoY Growth in year ended Mar 2026 is 87.54% vs 22,21,750.00% in Mar 2025",
        "dir": -1
      },
      {
        "prefix": "Consolidated Net Profit ",
        "suffix": "YoY Growth in year ended Mar 2026 is 205.38% vs -1,102.68% in Mar 2025",
        "dir": 1
      }
    ],
    "table": {
      "header": [
        "Mar'26",
        "Mar'25",
        "Change(%)"
      ],
      "body": [
        {
          "field": "Net Sales",
          "val1": "833.38",
          "val2": "444.37",
          "chgp": "87.54%",
          "chgp_class": "positive"
        },
        {
          "field": "Operating Profit (PBDIT) excl Other Income",
          "val1": "276.56",
          "val2": "-204.43",
          "chgp": "235.28%",
          "chgp_class": "positive"
        },
        {
          "field": "Interest",
          "val1": "43.18",
          "val2": "64.75",
          "chgp": "-33.31%",
          "chgp_class": "positive"
        },
        {
          "field": "Exceptional Items",
          "val1": "-64.86",
          "val2": "0.00",
          "chgp": "",
          "chgp_class": "neutral"
        },
        {
          "field": "Consolidate Net Profit",
          "val1": "273.87",
          "val2": "-259.90",
          "chgp": "205.38%",
          "chgp_class": "positive"
        },
        {
          "field": "Operating Profit Margin (Excl OI)",
          "val1": "33.23%",
          "val2": "-46.00%",
          "chgp": "79.23%",
          "chgp_class": "positive"
        }
      ]
    }
  }
]

Quarterly Results Snapshot (Consolidated) - Jun'26 - QoQstock-summary

Jun'26
Mar'26
Change(%)
Net Sales
359.45
408.53
-12.01%
Operating Profit (PBDIT) excl Other Income
153.93
170.06
-9.48%
Interest
9.64
9.93
-2.92%
Exceptional Items
0.00
-64.86
100.00%
Consolidate Net Profit
142.99
196.00
-27.05%
Operating Profit Margin (Excl OI)
48.33%
41.63%
6.70%
Values in Rs Cr.
Direction Arrows
Net Sales

QoQ Growth in quarter ended Jun 2026 is -12.01% vs 321.34% in Mar 2026

Direction Arrows
Consolidated Net Profit

QoQ Growth in quarter ended Jun 2026 is -27.05% vs 146.94% in Mar 2026

Half Yearly Results Snapshot (Consolidated) - Sep'25stock-summary

Sep'25
Sep'24
Change(%)
Net Sales
327.89
236.36
38.72%
Operating Profit (PBDIT) excl Other Income
120.73
-46.38
360.31%
Interest
23.18
44.90
-48.37%
Exceptional Items
0.00
0.00
Consolidate Net Profit
-1.50
-92.91
98.39%
Operating Profit Margin (Excl OI)
36.82%
-19.62%
56.44%
Values in Rs Cr.
Direction Arrows
Net Sales

Growth in half year ended Sep 2025 is 38.72% vs 98,383.33% in Sep 2024

Direction Arrows
Consolidated Net Profit

Growth in half year ended Sep 2025 is 98.39% vs -726.60% in Sep 2024

Nine Monthly Results Snapshot (Consolidated) - Dec'25stock-summary

Dec'25
Dec'24
Change(%)
Net Sales
424.85
342.79
23.94%
Operating Profit (PBDIT) excl Other Income
106.50
-22.07
582.56%
Interest
33.25
51.69
-35.67%
Exceptional Items
0.00
0.00
Consolidate Net Profit
77.87
-96.60
180.61%
Operating Profit Margin (Excl OI)
25.07%
-6.44%
31.51%
Values in Rs Cr.
Direction Arrows
Net Sales

YoY Growth in nine months ended Dec 2025 is 23.94% vs 17,13,850.00% in Dec 2024

Direction Arrows
Consolidated Net Profit

YoY Growth in nine months ended Dec 2025 is 180.61% vs -547.89% in Dec 2024

Annual Results Snapshot (Consolidated) - Mar'26stock-summary

Mar'26
Mar'25
Change(%)
Net Sales
833.38
444.37
87.54%
Operating Profit (PBDIT) excl Other Income
276.56
-204.43
235.28%
Interest
43.18
64.75
-33.31%
Exceptional Items
-64.86
0.00
Consolidate Net Profit
273.87
-259.90
205.38%
Operating Profit Margin (Excl OI)
33.23%
-46.00%
79.23%
Values in Rs Cr.
Direction Arrows
Net Sales

YoY Growth in year ended Mar 2026 is 87.54% vs 22,21,750.00% in Mar 2025

Direction Arrows
Consolidated Net Profit

YoY Growth in year ended Mar 2026 is 205.38% vs -1,102.68% in Mar 2025

stock-summaryCompany CV
About Indiabulls Limited stock-summary
stock-summary
Indiabulls Limited
Small Cap
Diversified Commercial Services
Indiabulls Limited was initially incorporated as 'SORIL Holdings and Ventures Limited' on July 24, 2007 as a Public Limited Company. The name of the Company was changed from 'SORIL Holdings and Ventures Limited'' to 'Indiabulls Integrated Services Limited' on 16 May, 2018 and a fresh Certificate of Incorporation was, issued by Registrar of Companies, NCT of Delhi & Haryana.
Company Coordinates stock-summary
Company Details
Plot No 448-451 Udyog Vihar, Phase-V Gurugram Haryana : 122016
stock-summary
Tel:
stock-summary
helpdesk@indiabulls.com
Registrar Details
Karvy Computershare Pvt Ltd, Plot No 17-24 , Near Image Hospital,, Reliance Cybervilae,Vithalrao Nagar,, Madhapur, Hyderabad