
Compare Smartworks Cowor with Similar Stocks
Dashboard
With HIgh Debt (Debt-Equity Ratio at 8.53 times)- the company has a Weak Long Term Fundamental Strength
- High Debt Company with a Debt to Equity ratio (avg) of 5.11 times
- The company has reported losses. Due to this company has reported negative ROE
With a growth in Net Profit of 5079.31%, the company declared Outstanding results in Mar 26
With ROCE of 6.2, it has a Fair valuation with a 2 Enterprise value to Capital Employed
Majority shareholders : Promoters
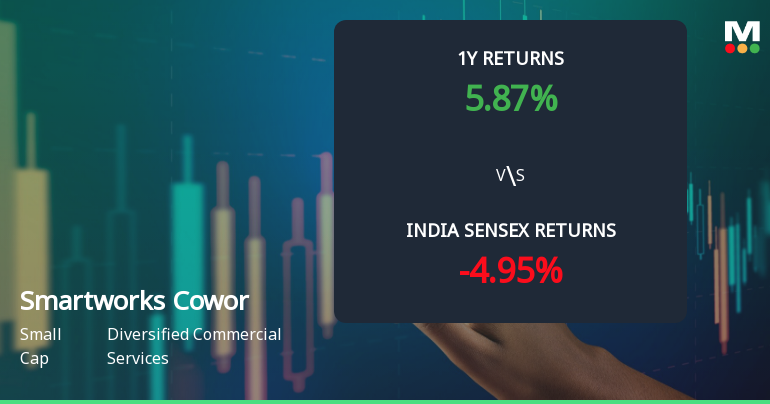
Market Beating Performance
Stock DNA
Diversified Commercial Services
INR 5,566 Cr (Small Cap)
529.00
33
0.00%
8.53
1.32%
10.51
Total Returns (Price + Dividend) 
Smartworks Cowor for the last several years.
Risk Adjusted Returns v/s
Returns Beta

News
Smartworks Coworking Spaces Ltd Sees Technical Momentum Shift Amid Market Recovery
Smartworks Coworking Spaces Ltd has demonstrated a notable shift in technical momentum, transitioning from a mildly bearish to a mildly bullish trend, supported by key indicator signals and a strong day-on-day price gain of 6.83%. This development comes as the small-cap stock outperforms the broader market, signalling renewed investor interest in the diversified commercial services sector.
Read full news article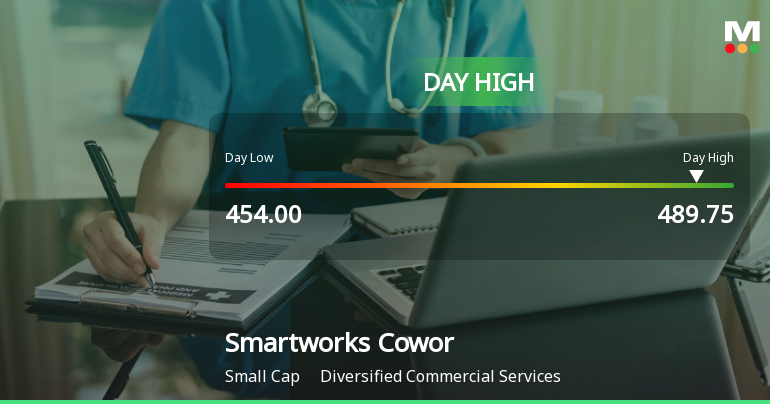
Smartworks Coworking Spaces Ltd Surges 7.0% to Day's High of Rs 486.45 — Outperforms Sector by 6.68 Percentage Points
The Sensex declined 0.54% on 20 Jul 2026 while Smartworks Coworking Spaces Ltd surged 7.0%, outperforming its sector by 6.68 percentage points. This sharp single-session gain stands out as a stock-specific event amid a broadly negative market backdrop.
Read full news article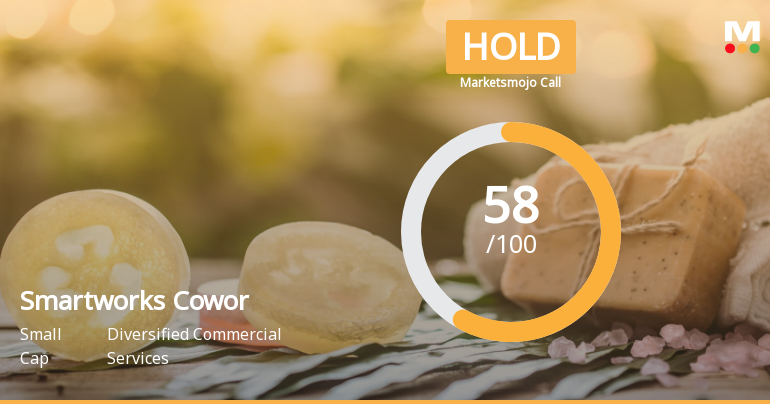
Smartworks Coworking Spaces Ltd is Rated Hold
Smartworks Coworking Spaces Ltd is rated 'Hold' by MarketsMOJO, with this rating last updated on 13 July 2026. However, the analysis and financial metrics discussed here reflect the company’s current position as of 20 July 2026, providing investors with the latest insights into its performance and outlook.
Read full news article Announcements
Disclosure Under Regulation 30 Of SEBI (Listing Obligations And Disclosure Requirements) Regulations 2015 - Capacity Addition
17-Jul-2026 | Source : BSEDisclosure under Regulation 30 of SEBI (Listing Obligations and Disclosure Requirements) Regulations 2015 - Capacity Addition
Announcement under Regulation 30 (LODR)-Analyst / Investor Meet - Intimation
15-Jul-2026 | Source : BSEIntimation under Regulation 30 read with Schedule III of the Securities and Exchange Board of India (SEBI) (Listing Obligations and Disclosure Requirements) Regulations 2015 - Earning Conference Call with Investors and Analysts for Q1 FY 2026-27 Performance and Business Updates.
Press Release - Indian Subsidiary Of UK-Headquartered Professional Services Firm Expands With Smartworks; Leases Over 930 Seats In Pune
13-Jul-2026 | Source : BSEPress Release - Indian Subsidiary of UK-Headquartered Professional Services Firm Expands with Smartworks; Leases Over 930 Seats in Pune
Corporate Actions

22 Jul 2026

No Dividend history available

No Splits history available

No Bonus history available

No Rights history available
Quality key factors
Valuation key factors
Technicals key factors
 Technical Indicator Scale: Bearish, Mildly Bearish, Sideways, Mildly Bullish, Bullish Turned
 Shareholding Snapshot : Mar 2026
Shareholding Compare (%holding)
Promoters
None
Held by 9 Schemes (3.15%)
Held by 7 FIIs (0.15%)
Ns Niketan (37.03%)
Space Solutions India Pte. Ltd. (14.9%)
7.71%
Quarterly Results Snapshot (Standalone) - Mar'26 - QoQ

QoQ Growth in quarter ended Mar 2026 is 9.90% vs 11.46% in Dec 2025

QoQ Growth in quarter ended Mar 2026 is 5,079.31% vs 107.63% in Dec 2025
Half Yearly Results Snapshot (Standalone) - Sep'25
Not Applicable: The company has declared_date for only one period
Not Applicable: The company has declared_date for only one period
Nine Monthly Results Snapshot (Standalone) - Dec'25
Not Applicable: The company has declared_date for only one period
Not Applicable: The company has declared_date for only one period
Annual Results Snapshot (Consolidated) - Mar'26
YoY Growth in year ended Mar 2026 is 30.69% vs 32.20% in Mar 2025
YoY Growth in year ended Mar 2026 is 116.67% vs -26.46% in Mar 2025
About Smartworks Coworking Spaces Ltd

Company Coordinates


