
Compare Nirlon with Similar Stocks
Dashboard
High Debt Company with a Debt to Equity ratio (avg) of 2.50 times
- Poor long term growth as Operating profit has grown by an annual rate 19.83% of over the last 5 years
- High Debt Company with a Debt to Equity ratio (avg) of 2.50 times
Poor long term growth as Operating profit has grown by an annual rate 19.83% of over the last 5 years
The company has declared Positive results for the last 4 consecutive quarters
With ROCE of 35.3, it has a Very Expensive valuation with a 4.9 Enterprise value to Capital Employed
Despite the size of the company, domestic mutual funds hold only 0.2% of the company
Stock DNA
Diversified Commercial Services
INR 5,611 Cr (Small Cap)
16.00
32
4.17%
1.81
73.83%
12.00
Total Returns (Price + Dividend) 
Latest dividend: 15 per share ex-dividend date: Feb-20-2026
Risk Adjusted Returns v/s
Returns Beta

News
Nirlon Ltd is Rated Hold by MarketsMOJO
Nirlon Ltd is rated 'Hold' by MarketsMOJO, with this rating last updated on 27 April 2026. However, the analysis and financial metrics discussed here reflect the stock's current position as of 22 June 2026, providing investors with an up-to-date view of the company’s fundamentals, returns, and market standing.
Read full news article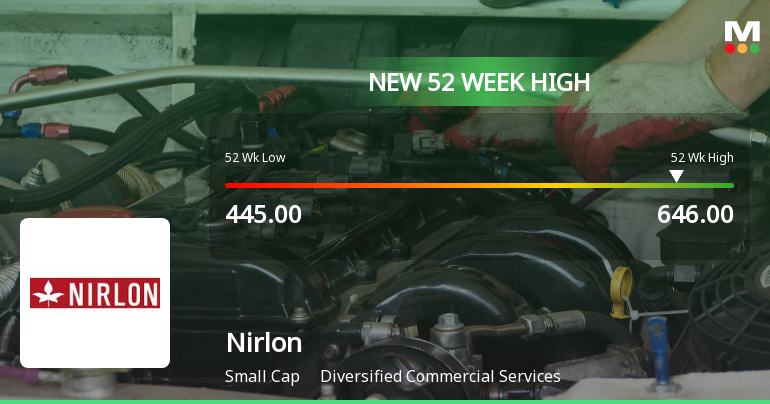
Broad-Based Technical Strength Lifts Nirlon Ltd to 52-Week High of Rs 646
With a decisive breakout to Rs 646 on 22 Jun 2026, Nirlon Ltd has reached a fresh 52-week high, extending its impressive 23.9% gain over the past year against the Sensex’s decline of 6.42%. This milestone reflects a confluence of strong technical momentum and sustained price strength that has propelled the stock well above key moving averages.
Read full news article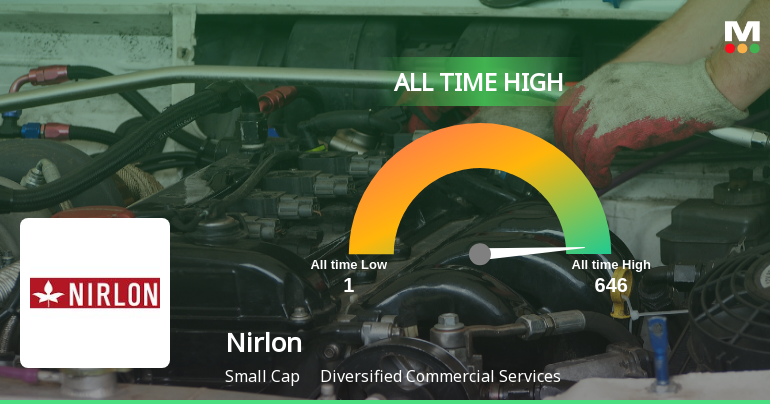
Nirlon Ltd Hits All-Time High of Rs 646 as Momentum Builds Across Timeframes
Extending its winning streak to three sessions, Nirlon Ltd touched a fresh all-time high of Rs 646 on 22 Jun 2026, marking a significant milestone in its recent rally. The stock outperformed its sector by 3.62% today, reflecting strong buying interest amid broad market volatility.
Read full news article Announcements
Announcement under Regulation 30 (LODR)-Earnings Call Transcript
29-May-2026 | Source : BSEEarning call transcript of the Investors call held on Tuesday May 26 2026
Announcement under Regulation 30 (LODR)-Analyst / Investor Meet - Outcome
26-May-2026 | Source : BSEEarning conference call held on Tuesday May 26 2026
Announcement under Regulation 30 (LODR)-Newspaper Publication
26-May-2026 | Source : BSEThe Company has issued newspaper notice as required under SEBI circular as required for share transfer objection claim
Corporate Actions

No Upcoming Board Meetings

Nirlon Ltd has declared 150% dividend, ex-date: 20 Feb 26

No Splits history available

No Bonus history available

No Rights history available
Quality key factors
Valuation key factors
Technicals key factors
 Technical Indicator Scale: Bearish, Mildly Bearish, Sideways, Mildly Bullish, Bullish Turned
 Shareholding Snapshot : Mar 2026
Shareholding Compare (%holding)
Promoters
None
Held by 2 Schemes (0.06%)
Held by 7 FIIs (15.78%)
Reco Berry Private Limited (63.92%)
Bsrep Iv Fpi Two Holdings Difc Ltd. (10%)
6.93%
Quarterly Results Snapshot (Standalone) - Mar'26 - QoQ

QoQ Growth in quarter ended Mar 2026 is 0.59% vs 2.79% in Dec 2025

QoQ Growth in quarter ended Mar 2026 is 1.83% vs -53.05% in Dec 2025
Half Yearly Results Snapshot (Standalone) - Sep'25
Growth in half year ended Sep 2025 is 3.66% vs 6.40% in Sep 2024
Growth in half year ended Sep 2025 is 93.82% vs 3.97% in Sep 2024
Nine Monthly Results Snapshot (Standalone) - Dec'25
YoY Growth in nine months ended Dec 2025 is 4.22% vs 6.29% in Dec 2024
YoY Growth in nine months ended Dec 2025 is 67.29% vs 6.64% in Dec 2024
Annual Results Snapshot (Standalone) - Mar'26
YoY Growth in year ended Mar 2026 is 5.20% vs 5.46% in Mar 2025
YoY Growth in year ended Mar 2026 is 58.57% vs 6.14% in Mar 2025
About Nirlon Ltd

Company Coordinates


