
Compare Indian Energy Ex with Similar Stocks
Dashboard
Poor long term growth as Net Sales has grown by an annual rate of 14.14% and Operating profit at 16.24% over the last 5 years
Flat results in Mar 26
With ROE of 36.1, it has a Very Expensive valuation with a 8.2 Price to Book Value
Below par performance in long term as well as near term
Stock DNA
Capital Markets
INR 10,754 Cr (Small Cap)
23.00
24
2.94%
-1.31
36.12%
7.78
Total Returns (Price + Dividend) 
Latest dividend: 2 per share ex-dividend date: May-15-2026
Risk Adjusted Returns v/s
Returns Beta

News
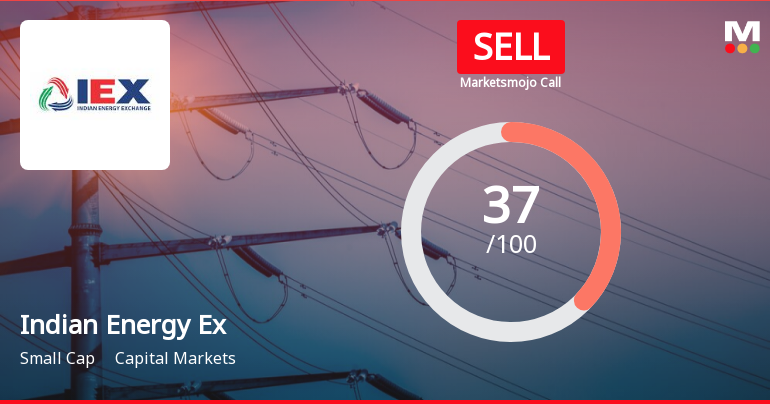
Indian Energy Exchange Ltd is Rated Sell
Indian Energy Exchange Ltd is rated 'Sell' by MarketsMOJO, with this rating last updated on 18 Aug 2025. However, the analysis and financial metrics discussed here reflect the stock's current position as of 16 July 2026, providing investors with an up-to-date perspective on its performance and outlook.
Read full news article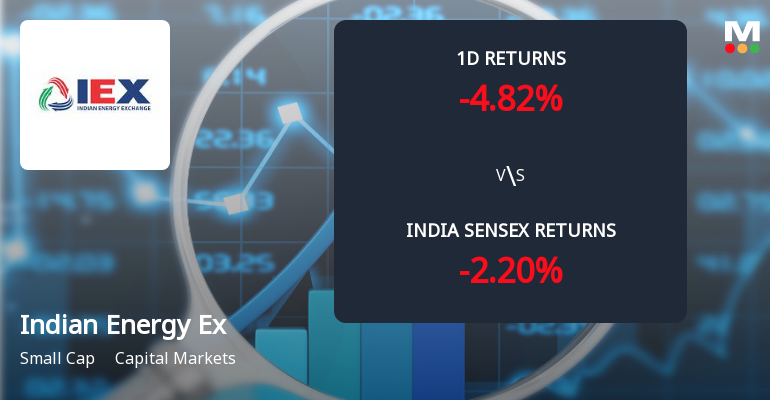
Indian Energy Exchange Ltd Sees Sharp Open Interest Surge Amid Bearish Price Action
Indian Energy Exchange Ltd (IEX) has witnessed a notable 13.9% increase in open interest in its derivatives segment, rising from 27,013 to 30,762 contracts. This surge comes despite the stock’s recent underperformance, signalling a complex market positioning that warrants close attention from investors and traders alike.
Read full news article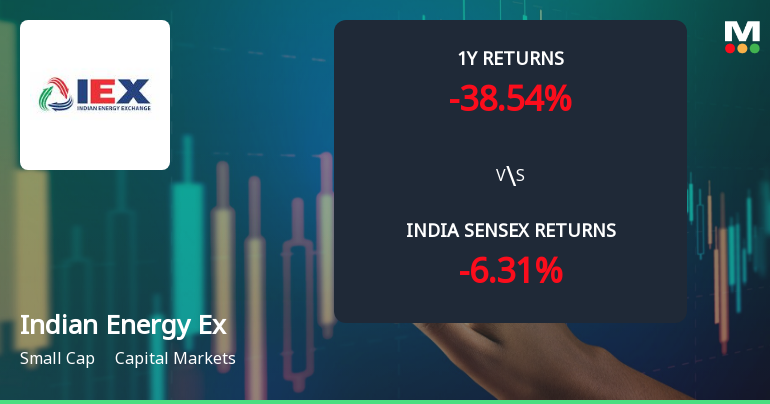
Indian Energy Exchange Ltd Faces Bearish Momentum Amid Technical Downturn
Indian Energy Exchange Ltd (IEX) has experienced a notable shift in its technical momentum, with key indicators signalling a transition from mildly bearish to bearish trends. This change coincides with a downgrade in its MarketsMOJO Mojo Grade from Hold to Sell, reflecting growing concerns over the stock’s near-term performance amid subdued price action and weakening technical signals.
Read full news article Announcements
Indian Energy Exchange Limited - Press Release
05-Dec-2019 | Source : NSEIndian Energy Exchange Limited has informed the Exchange regarding a press release dated December 05, 2019, titled "Power Market Update November 2019".
Indian Energy Exchange Limited - Analysts/Institutional Investor Meet/Con. Call Updates
28-Nov-2019 | Source : NSEIndian Energy Exchange Limited has informed the Exchange regarding Analysts/Institutional Investor Meet/Con. Call Updates
Indian Energy Exchange Limited - Analysts/Institutional Investor Meet/Con. Call Updates
27-Nov-2019 | Source : NSEIndian Energy Exchange Limited has informed the Exchange regarding Analysts/Institutional Investor Meet/Con. Call Updates
Corporate Actions

23 Jul 2026

Indian Energy Exchange Ltd has declared 200% dividend, ex-date: 15 May 26

Indian Energy Exchange Ltd has announced 1:10 stock split, ex-date: 19 Oct 18

Indian Energy Exchange Ltd has announced 2:1 bonus issue, ex-date: 03 Dec 21

No Rights history available
Quality key factors
Valuation key factors
Technicals key factors
 Technical Indicator Scale: Bearish, Mildly Bearish, Sideways, Mildly Bullish, Bullish Turned
 Shareholding Snapshot : Mar 2026
Shareholding Compare (%holding)
Non Institution
None
Held by 26 Schemes (22.09%)
Held by 168 FIIs (14.16%)
None
Parag Parikh Mutual Fund Under Its Various Schemes (9.5%)
36.93%
Quarterly Results Snapshot (Consolidated) - Mar'26 - YoY

YoY Growth in quarter ended Mar 2026 is 22.53% vs 17.29% in Mar 2025

YoY Growth in quarter ended Mar 2026 is 10.81% vs 21.12% in Mar 2025
Half Yearly Results Snapshot (Consolidated) - Sep'25
Growth in half year ended Sep 2025 is 12.44% vs 23.71% in Sep 2024
Growth in half year ended Sep 2025 is 19.18% vs 26.17% in Sep 2024
Nine Monthly Results Snapshot (Consolidated) - Dec'25
YoY Growth in nine months ended Dec 2025 is 11.73% vs 20.48% in Dec 2024
YoY Growth in nine months ended Dec 2025 is 16.38% vs 22.81% in Dec 2024
Annual Results Snapshot (Consolidated) - Mar'26
YoY Growth in year ended Mar 2026 is 14.59% vs 19.62% in Mar 2025
YoY Growth in year ended Mar 2026 is 14.85% vs 22.35% in Mar 2025
About Indian Energy Exchange Ltd

Company Coordinates


