
Compare Indian Infotech with Similar Stocks
Dashboard
With a Operating Losses, the company has a Weak Long Term Fundamental Strength
- Poor long term growth as Net Sales has grown by an annual rate of 9.28% and Operating profit at 16.68% over the last 5 years
- Company's ability to service its debt is weak with a poor EBIT to Interest (avg) ratio of -0.26
With ROE of 0.4, it has a Expensive valuation with a 0.3 Price to Book Value
Stock DNA
Non Banking Financial Company (NBFC)
INR 105 Cr (Micro Cap)
76.00
21
0.00%
0.00
0.44%
0.34
Total Returns (Price + Dividend) 
Indian Infotech for the last several years.
Risk Adjusted Returns v/s
Returns Beta

News

Indian Infotech and Software Ltd is Rated Strong Sell
Indian Infotech and Software Ltd is rated 'Strong Sell' by MarketsMOJO, a rating that was last updated on 14 Feb 2025. However, the analysis and financial metrics discussed here reflect the stock's current position as of 02 June 2026, providing investors with an up-to-date view of the company’s fundamentals, valuation, financial trend, and technical outlook.
Read full news article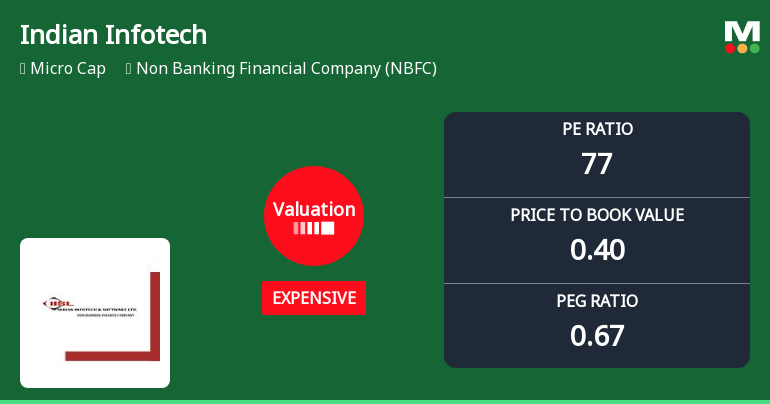
Indian Infotech and Software Ltd Valuation Shifts Signal Heightened Risk Amidst Market Challenges
Indian Infotech and Software Ltd, a micro-cap player in the Non Banking Financial Company (NBFC) sector, has seen a notable shift in its valuation parameters, moving from a very expensive to an expensive rating. Despite a modest day gain of 1.61%, the company’s elevated price-to-earnings (P/E) ratio and subdued return metrics raise questions about its price attractiveness relative to peers and historical benchmarks.
Read full news article
Indian Infotech and Software Ltd is Rated Strong Sell
Indian Infotech and Software Ltd is rated Strong Sell by MarketsMOJO. This rating was last updated on 14 Feb 2025. However, the analysis and financial metrics discussed below reflect the stock’s current position as of 22 May 2026, providing investors with an up-to-date view of the company’s fundamentals, valuation, financial trends, and technical outlook.
Read full news article Announcements
Announcement under Regulation 30 (LODR)-Newspaper Publication
01-Jun-2026 | Source : BSENewspaper publication for Financial result 31st March 2026
Pursuant To Regulation 32(6) Of The SEBI (Listing Obligations And Disclosure Requirements) Regulations 2015 Read With Regulation 82(4) Of SEBI (Issue Of Capital And Disclosure Requirements) Regulations 2018 Please Find Enclosed The Monitoring Agency Repor
30-May-2026 | Source : BSEFund Utilisation certificate
Results For The Financial Year 31St March 2026
30-May-2026 | Source : BSEResults for the Financial Year 31st March 2026
Corporate Actions

No Upcoming Board Meetings

No Dividend history available

Indian Infotech and Software Ltd has announced 1:10 stock split, ex-date: 02 Feb 12

No Bonus history available

Indian Infotech and Software Ltd has announced 1:3 rights issue, ex-date: 28 Jul 25
Quality key factors
Valuation key factors
Technicals key factors
 Technical Indicator Scale: Bearish, Mildly Bearish, Sideways, Mildly Bullish, Bullish Turned
 Shareholding Snapshot : Mar 2026
Shareholding Compare (%holding)
Non Institution
None
Held by 1 Schemes (0.0%)
Held by 0 FIIs
Jayanti Prime Software Advisory Private Limited (6.59%)
Blackberry Sarees Private Limited (3.77%)
74.3%
Quarterly Results Snapshot (Standalone) - Mar'26 - QoQ

QoQ Growth in quarter ended Mar 2026 is 516.12% vs -49.87% in Dec 2025

QoQ Growth in quarter ended Mar 2026 is -288.10% vs -129.68% in Dec 2025
Half Yearly Results Snapshot (Standalone) - Sep'25
Growth in half year ended Sep 2025 is -23.56% vs 167.03% in Sep 2024
Growth in half year ended Sep 2025 is -27.42% vs 4.72% in Sep 2024
Nine Monthly Results Snapshot (Standalone) - Dec'25
YoY Growth in nine months ended Dec 2025 is -20.22% vs 115.89% in Dec 2024
YoY Growth in nine months ended Dec 2025 is 379.52% vs -115.41% in Dec 2024
Annual Results Snapshot (Standalone) - Mar'26
YoY Growth in year ended Mar 2026 is 62.59% vs 86.70% in Mar 2025
YoY Growth in year ended Mar 2026 is 119.94% vs -504.68% in Mar 2025
About Indian Infotech and Software Ltd

Company Coordinates


