
Compare Inter Globe Fin with Similar Stocks
Stock DNA
Non Banking Financial Company (NBFC)
INR 91 Cr (Micro Cap)
58.00
21
0.00%
0.06
1.11%
0.64
Total Returns (Price + Dividend) 
Latest dividend: 0.5 per share ex-dividend date: Sep-18-2017
Risk Adjusted Returns v/s
Returns Beta

News
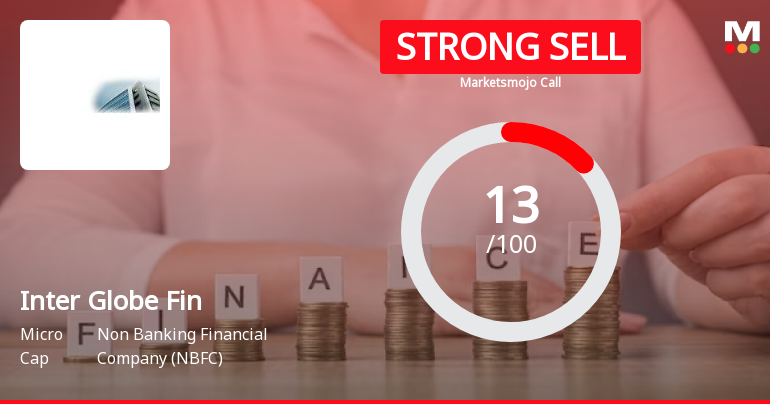
Inter Globe Finance Ltd is Rated Strong Sell
Inter Globe Finance Ltd is rated Strong Sell by MarketsMOJO, with this rating last updated on 05 Jan 2026. However, the analysis and financial metrics discussed here reflect the company’s current position as of 16 June 2026, providing investors with an up-to-date view of the stock’s fundamentals, valuation, financial trends, and technical outlook.
Read full news article
Inter Globe Finance Ltd is Rated Strong Sell
Inter Globe Finance Ltd is rated Strong Sell by MarketsMOJO. This rating was last updated on 05 Jan 2026, reflecting a reassessment of the stock’s outlook. However, all fundamentals, returns, and financial metrics discussed here are current as of 04 June 2026, providing investors with the latest perspective on the company’s position.
Read full news article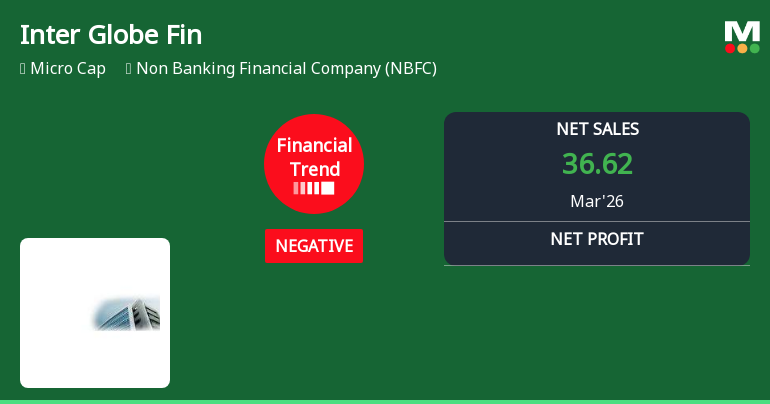
Inter Globe Finance Ltd Reports Sharp Quarterly Decline Amid Negative Financial Trend
Inter Globe Finance Ltd, a micro-cap player in the Non Banking Financial Company (NBFC) sector, has reported a marked deterioration in its quarterly financial performance for March 2026. The company’s financial trend has shifted from very negative to negative, with key metrics such as profit before tax, net sales, and profit after tax showing significant declines compared to previous quarters. This downturn comes despite a strong cash position, raising concerns about the company’s operational efficiency and growth prospects.
Read full news article Announcements
Announcement under Regulation 30 (LODR)-Newspaper Publication
27-May-2026 | Source : BSENewspaper publication
Statement Of Deviation & Variation
27-May-2026 | Source : BSEStatement of Deviation & variation
Audited Standalone Financial Results For Quarter & Year Ended 31.03.2026
26-May-2026 | Source : BSEAudited standalone Financial Results for Quarter & Year ended MArch 31 2026
Corporate Actions

No Upcoming Board Meetings

Inter Globe Finance Ltd has declared 5% dividend, ex-date: 18 Sep 17

No Splits history available

No Bonus history available

No Rights history available
Quality key factors
Valuation key factors
Technicals key factors
 Technical Indicator Scale: Bearish, Mildly Bearish, Sideways, Mildly Bullish, Bullish Turned
 Shareholding Snapshot : Mar 2026
Shareholding Compare (%holding)
Promoters
None
Held by 0 Schemes
Held by 0 FIIs
Manju Jain (22.8%)
Vijay Kumar Jain (5.16%)
31.87%
Quarterly Results Snapshot (Standalone) - Mar'26 - QoQ

QoQ Growth in quarter ended Mar 2026 is 21.46% vs -33.10% in Dec 2025
QoQ Growth in quarter ended Mar 2026 is -103.39% vs -148.36% in Dec 2025
Half Yearly Results Snapshot (Standalone) - Sep'25

Growth in half year ended Sep 2025 is 11.67% vs 58.59% in Sep 2024
Growth in half year ended Sep 2025 is 150.73% vs 9.60% in Sep 2024
Nine Monthly Results Snapshot (Standalone) - Dec'25
YoY Growth in nine months ended Dec 2025 is -33.79% vs 52.56% in Dec 2024
YoY Growth in nine months ended Dec 2025 is 300.79% vs -240.33% in Dec 2024
Annual Results Snapshot (Standalone) - Mar'26
YoY Growth in year ended Mar 2026 is 21.79% vs -35.00% in Mar 2025
YoY Growth in year ended Mar 2026 is -33.23% vs -60.07% in Mar 2025
About Inter Globe Finance Ltd

Company Coordinates


