
Compare Indian Metals with Similar Stocks
Dashboard
Company has a Debt to Equity ratio (avg) of 0.08 times
Poor long term growth as Net Sales has grown by an annual rate of 8.91% and Operating profit at 17.76% over the last 5 years
Flat results in Mar 26
With ROCE of 16.1, it has a Very Expensive valuation with a 2.5 Enterprise value to Capital Employed
Increasing Participation by Institutional Investors
Market Beating performance in long term as well as near term
Stock DNA
Ferrous Metals
INR 7,397 Cr (Small Cap)
18.00
13
0.72%
0.20
15.61%
2.76
Total Returns (Price + Dividend) 
Latest dividend: 5.022784148209016 per share ex-dividend date: Nov-11-2025
Risk Adjusted Returns v/s
Returns Beta

News
Indian Metals & Ferro Alloys Ltd is Rated Hold
Indian Metals & Ferro Alloys Ltd is rated 'Hold' by MarketsMOJO, with this rating last updated on 04 Feb 2026. However, all fundamentals, returns, and financial metrics discussed here reflect the stock's current position as of 19 June 2026, providing investors with an up-to-date analysis of the company’s standing.
Read full news article
Indian Metals & Ferro Alloys Ltd Technical Momentum Shifts Amid Mixed Indicator Signals
Indian Metals & Ferro Alloys Ltd has experienced a nuanced shift in its technical momentum, moving from a bullish to a mildly bullish trend as of mid-June 2026. While some indicators suggest cautious optimism, others reveal underlying bearish pressures, reflecting a complex market sentiment for this small-cap ferrous metals player.
Read full news article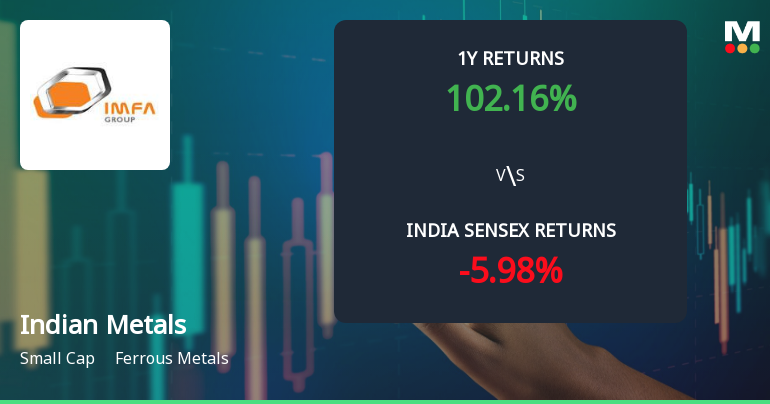
Indian Metals & Ferro Alloys Ltd Technical Momentum Shifts to Bullish Amid Strong Price Gains
Indian Metals & Ferro Alloys Ltd has demonstrated a notable shift in price momentum, supported by a series of bullish technical indicators that have upgraded its outlook from a previous Sell to a Hold rating. The stock’s recent performance, combined with positive signals from MACD, Bollinger Bands, and moving averages, suggests growing investor confidence in this ferrous metals small-cap.
Read full news article Announcements
Closure of Trading Window
22-Jun-2026 | Source : BSEAs per corporate announcement attached
Announcement under Regulation 30 (LODR)-Earnings Call Transcript
03-Jun-2026 | Source : BSEAs per corporate announcement attached
Announcement under Regulation 30 (LODR)-Newspaper Publication
28-May-2026 | Source : BSENewspaper advertisement of Audited Financial for the quarter and year ended 31/03/2026
Corporate Actions

No Upcoming Board Meetings

Indian Metals & Ferro Alloys Ltd has declared 75% dividend, ex-date: 31 Jul 26

No Splits history available

Indian Metals & Ferro Alloys Ltd has announced 1:1 bonus issue, ex-date: 07 Jan 22

No Rights history available
Quality key factors
Valuation key factors
Technicals key factors
 Technical Indicator Scale: Bearish, Mildly Bearish, Sideways, Mildly Bullish, Bullish Turned
 Shareholding Snapshot : Mar 2026
Shareholding Compare (%holding)
Promoters
None
Held by 8 Schemes (0.17%)
Held by 91 FIIs (3.87%)
Subhrakant Panda, Trustee, B Panda Trust (51.59%)
Litec Company Limited (12.77%)
18.82%
Quarterly Results Snapshot (Consolidated) - Mar'26 - QoQ

QoQ Growth in quarter ended Mar 2026 is 8.60% vs -2.20% in Dec 2025

QoQ Growth in quarter ended Mar 2026 is -21.38% vs 34.68% in Dec 2025
Half Yearly Results Snapshot (Consolidated) - Sep'25
Growth in half year ended Sep 2025 is 0.44% vs -2.88% in Sep 2024
Growth in half year ended Sep 2025 is -20.29% vs 19.30% in Sep 2024
Nine Monthly Results Snapshot (Consolidated) - Dec'25
YoY Growth in nine months ended Dec 2025 is 3.28% vs -3.95% in Dec 2024
YoY Growth in nine months ended Dec 2025 is -3.12% vs 7.51% in Dec 2024
Annual Results Snapshot (Consolidated) - Mar'26
YoY Growth in year ended Mar 2026 is 10.21% vs -7.75% in Mar 2025
YoY Growth in year ended Mar 2026 is 12.03% vs 10.23% in Mar 2025
About Indian Metals & Ferro Alloys Ltd

Company Coordinates


