Indian Metals

  • Market Cap: Small Cap
  • Industry: Ferrous Metals
  • ISIN: INE919H01018
  • NSEID: IMFA
  • BSEID: 533047
INR
1,317.60
-53.1 (-3.87%)
BSENSE

Aug 31, 03:30 PM

BSE+NSE Vol: 1.47 lacs

  • Price Points
  • Score
  • Mojo Parameters
  • Total Return
  • News and Corporate Actions
  • Key factors
  • Shareholding
  • Financials
  • CompanyCV
stock-summaryPrice Point
High/Low

1Day

52 Week

Valuation
Technical
Day's Volume

CASH

1.47 lacs (41.47%) Volume

Shareholding (Jun 2026)

FII

3.59%

Held by 85 FIIs

DII

0.88%

Held by 0 DIIs

Promoter

58.69%

Why is Indian Metals & Ferro Alloys Ltd falling/rising?

31-Aug-2026

As of 30-Aug, Indian Metals & Ferro Alloys Ltd's stock price is rising to Rs 1,371.50, driven by strong quarterly results and positive market sentiment. However, concerns about long-term growth and high valuation relative to peers may limit investor enthusiasm.

As of 30-Aug, Indian Metals & Ferro Alloys Ltd's stock price is experiencing a slight rise, currently at Rs 1,371.50, reflecting an increase of 3.6 points or 0.26%. This upward movement can be attributed to several factors. Notably, the stock has outperformed its sector by 0.97% today, indicating positive market sentiment. Additionally, the stock reached an intraday high of Rs 1,395.95, which is a 2.05% increase from its previous levels.<BR><BR>The company has reported strong financial results for the quarter ending June 26, with a profit after tax (PAT) of Rs 192.34 crore, marking an impressive growth of 81.3% compared to the previous four-quarter average. Furthermore, the operating profit to interest ratio is at its highest level of 22.57 times, and net sales have reached a record Rs 960.45 crore. These positive financial indicators contribute to a favorable outlook for the stock.<BR><BR>However, it is important to note that despite the recent rise, the stock has shown a decline of 0.97% over the past week and an 8.12% drop year-to-date. The long-term growth prospects appear limited, with net sales growing at an annual rate of only 9.73% and operating profit at 14.36% over the last five years. The stock is also considered expensive relative to its peers, trading at a premium compared to average historical valuations.<BR><BR>In summary, while Indian Metals & Ferro Alloys Ltd is currently experiencing a rise in stock price due to strong quarterly results and positive market performance today, concerns about long-term growth and valuation may temper investor enthusiasm.

View full answer

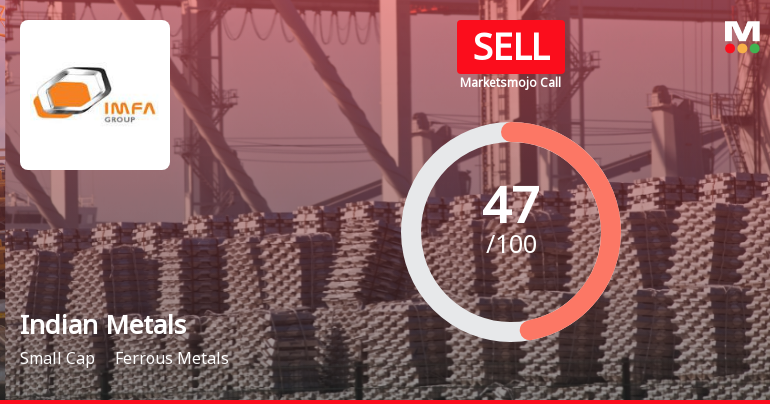
Should I buy, sell or hold Indian Metals & Ferro Alloys Ltd?

26-Aug-2026

Who are in the management team of Indian Metals?

14-Aug-2026

The management team of Indian Metals includes Baijayant Panda (Vice Chairman), Subhrakant Panda (Managing Director), N R Mohanty (Non-Executive Chairman), and several independent directors, along with key executives like the CFO and Whole-time Director, all of whom guide the company's strategic direction.

The management team of Indian Metals includes the following key individuals:<BR><BR>1. **Baijayant Panda** - Vice Chairman<BR>2. **Subhrakant Panda** - Managing Director<BR>3. **N R Mohanty** - Chairman (Non-Executive)<BR>4. **S P Mathur** - Independent Director<BR>5. **Prem Khandelwal** - Chief Finance Officer & Company Secretary<BR>6. **C R Ray** - Whole-time Director<BR>7. **Stefan Georg Amrein** - Director<BR>8. **Bijoy Kumar Das** - Independent Director<BR>9. **Latha Ravindran** - Independent Director<BR><BR>This team plays a crucial role in guiding the company's strategic direction and operations.

View full answer

What does Indian Metals do?

14-Aug-2026

Indian Metals & Ferro Alloys Ltd is a leading producer of ferro chrome in India, incorporated in 1961, with a market cap of INR 7,867 Cr and reported net sales of 960 Cr and net profit of 192 Cr for June 2026. Key metrics include a P/E of 15.00, dividend yield of 0.85%, and a debt-equity ratio of 0.20.

Overview:<BR>Indian Metals & Ferro Alloys Ltd is a leading, fully integrated producer of ferro chrome in India, operating within the ferrous metals industry and categorized as a small-cap company.<BR><BR>History:<BR>The company was incorporated on November 20, 1961. It has maintained its status as a prominent player in the ferro chrome production sector. The latest quarterly results reported net sales and profit for June 2026.<BR><BR>Financial Snapshot:<BR>- Net Sales: 960 Cr (Quarterly Results - Jun 2026)<BR>- Net Profit: 192 Cr (Quarterly Results - Jun 2026)<BR>- Market Cap: INR 7,867 Cr (Small Cap)<BR><BR>Key Metrics:<BR>- P/E: 15.00<BR>- Industry P/E: 12<BR>- Dividend Yield: 0.85%<BR>- Debt-Equity: 0.20<BR>- Return on Equity: 15.61%<BR>- Price to Book: 2.92<BR><BR>Contact Details:<BR>Address: IMFA Building Bhomikhal, P O Rasulgarh Bhubaneswar Orissa : 751010<BR>Tel: 91-674-2580100/25/3051000<BR>Email: mail@imfa.in<BR>Website: http://www.imfa.in

View full answer

Who are the peers of the Indian Metals?

14-Aug-2026

Peers of Indian Metals include Jindal Stainless, KIOCL, Sarda Energy, NMDC Steel, Kirl. Ferrous, Sunflag Iron, Jai Balaji Industries, Maithan Alloys, and Prakash Industries. Indian Metals has a strong capital structure and a 1-year return of 80.14%, outperforming peers like KIOCL (15.91%) and Jai Balaji Industries (-33.98%).

Peers: The peers of Indian Metals are Jindal Stain., KIOCL, Sarda Energy, NMDC Steel, Kirl. Ferrous, Sunflag Iron, Jai Balaji Inds., Maithan Alloys, and Prakash Industri.<BR><BR>Quality Snapshot: Excellent management risk is observed at Jindal Stain. and Kirl. Ferrous, while Average management risk is found at Sarda Energy, NMDC Steel, Sunflag Iron, Jai Balaji Inds., Maithan Alloys, and Prakash Industri, and the rest. Below Average management risk is noted at KIOCL and Prakash Industri. For Growth, Excellent growth is seen at Jindal Stain. and NMDC Steel, Good growth is found at Sarda Energy and Jai Balaji Inds., while Below Average growth is noted at KIOCL, Indian Metals, Kirl. Ferrous, Sunflag Iron, Maithan Alloys, and the rest. Capital Structure is Excellent for Indian Metals, Maithan Alloys, and Prakash Industri, Good for Jindal Stain., Sarda Energy, Kirl. Ferrous, and Sunflag Iron, and Below Average for KIOCL and NMDC Steel.<BR><BR>Return Snapshot: The peer with the highest 1-year return is KIOCL at 15.91%, while the peer with the lowest is Jai Balaji Inds. at -33.98%. Indian Metals has a significantly higher 1-year return of 80.14%. Additionally, Kirl. Ferrous, Jai Balaji Inds., Maithan Alloys, and Prakash Industri all have negative six-month returns.

View full answer

How big is Indian Metals?

14-Aug-2026

As of 14th August, Indian Metals & Ferro Alloys Ltd has a market capitalization of 7,567.33 Cr, with recent net sales of 3,145.22 Cr and a net profit of 524.33 Cr. Shareholder's funds are 2,717.52 Cr and total assets are valued at 4,316.53 Cr.

As of 14th August, Indian Metals & Ferro Alloys Ltd has a market capitalization of 7,567.33 Cr, categorizing it as a Small Cap company.<BR><BR>In the latest four quarters, the company reported Net Sales of 3,145.22 Cr and a Net Profit of 524.33 Cr.<BR><BR>For the latest annual period ending in March 2026, the Shareholder's Funds amounted to 2,717.52 Cr, while the Total Assets were valued at 4,316.53 Cr.

View full answer

Are Indian Metals & Ferro Alloys Ltd latest results good or bad?

05-Aug-2026

Indian Metals & Ferro Alloys Ltd reported strong Q1 FY27 results, with net sales up 49.71% year-on-year and a net profit increase of 108.41%. The company’s operating margin reached a two-year high, indicating a favorable performance driven by improved efficiencies and market conditions.

Indian Metals & Ferro Alloys Ltd (IMFA) has reported exceptionally strong results for Q1 FY27, marking a significant improvement compared to previous periods. The company achieved net sales of ₹960.45 crores, which is a remarkable 49.71% increase year-on-year and a 25.83% increase sequentially. This growth is complemented by a net profit of ₹192.34 crores, reflecting an impressive 108.41% year-on-year growth.<BR><BR>The operating margin has also seen a substantial rise, reaching 29.29%, the highest in over two years, driven by favorable commodity prices and improved operational efficiencies. The profit after tax (PAT) margin improved to 20.05%, up from 13.52% in the previous quarter, indicating effective cost management.<BR><BR>Overall, the results indicate a strong performance for IMFA, supported by a recovering ferro alloys industry and strategic advantages from its captive chrome ore mines. The company appears well-positioned to capitalize on ongoing demand in the stainless steel sector, making these results quite favorable.

View full answer

When is the next results date for Indian Metals & Ferro Alloys Ltd?

27-Jul-2026

The next results date for Indian Metals & Ferro Alloys Ltd is 04 August 2026.

The next results date for Indian Metals & Ferro Alloys Ltd is scheduled for 04 August 2026.

View full answer

Is Indian Metals overvalued or undervalued?

10-Nov-2025

As of November 7, 2025, Indian Metals is considered overvalued with a PE Ratio of 19.51 and unfavorable valuation metrics compared to peers like Maithan Alloys and Nagpur Power, despite a strong year-to-date stock performance of 39.88%.

As of 7 November 2025, the valuation grade for Indian Metals has moved from attractive to expensive, indicating a shift in perception regarding its market value. The company is currently considered overvalued. Key ratios include a PE Ratio of 19.51, an EV to EBITDA of 0.56, and a Price to Book Value of 0.26, which suggest that the company's valuation metrics are not favorable compared to its peers.<BR><BR>In comparison to its industry, Maithan Alloys, which is rated as attractive, has a significantly lower PE Ratio of 4.45 and an EV to EBITDA of 7.75, highlighting the disparity in valuation. Additionally, Nagpur Power is also categorized as expensive with a PE Ratio of 50.47, further illustrating the high valuation of Indian Metals relative to its competitors. Despite the recent stock performance showing a 39.88% return year-to-date compared to the Sensex's 6.50%, the current valuation metrics suggest that Indian Metals is not justified at its current price level.

View full answer

Is Indian Metals technically bullish or bearish?

06-Nov-2025

As of November 4, 2025, the technical trend is bullish, supported by strong indicators like the MACD and moving averages, despite a mildly bearish KST signal on the monthly chart.

As of 4 November 2025, the technical trend has changed from mildly bullish to bullish. The current stance is bullish with strong indicators supporting this view. The MACD is bullish on both the weekly and monthly time frames, while Bollinger Bands also indicate bullish momentum in both time frames. The moving averages on the daily chart are bullish, further reinforcing the positive outlook. Although the KST shows a mildly bearish signal on the monthly chart, the overall trend remains bullish according to Dow Theory and the On-Balance Volume (OBV) metrics, which are bullish on both weekly and monthly charts.

View full answer

Has Indian Metals declared dividend?

06-Nov-2025

Yes, Indian Metals & Ferro Alloys Ltd has declared a 50% dividend, amounting to ₹5 per share, with an ex-date of November 11, 2025. The company has shown strong total returns across various periods, with a 5-year total return of 810.83%.

Indian Metals & Ferro Alloys Ltd has declared a dividend.<BR><BR>Dividend Details:<BR>- Percentage announced: 50%<BR>- Amount per share: 5<BR>- Ex-date: 11 Nov 25<BR><BR>Dividend Yield: 1.63%.<BR><BR>Total Returns by Period:<BR>In the 3-month period, the price return was 59.08%, the dividend return was 0.68%, resulting in a total return of 59.76%.<BR><BR>In the 6-month period, the price return was 98.77%, the dividend return was 1.62%, leading to a total return of 100.39%.<BR><BR>In the 1-year period, the price return was 58.31%, the dividend return was 3.27%, culminating in a total return of 61.58%.<BR><BR>In the 2-year period, the price return was 158.75%, the dividend return was 9.47%, resulting in a total return of 168.22%.<BR><BR>In the 3-year period, the price return was 364.95%, the dividend return was 25.58%, leading to a total return of 390.53%.<BR><BR>In the 4-year period, the price return was 185.97%, the dividend return was 19.01%, culminating in a total return of 204.98%.<BR><BR>In the 5-year period, the price return was 751.98%, the dividend return was 58.85%, resulting in a total return of 810.83%.<BR><BR>Overall, Indian Metals & Ferro Alloys Ltd has declared a significant dividend alongside impressive total returns across various periods, indicating strong financial performance and shareholder value enhancement.

View full answer

How has been the historical performance of Indian Metals?

04-Nov-2025

Indian Metals' historical performance shows fluctuating trends, with net sales decreasing to 2,564.57 crore in March 2025, while profit after tax increased to 379.32 crore. Despite declining sales, the company reported improved profit metrics and a rise in total assets.

Answer:<BR>The historical performance of Indian Metals shows a fluctuating trend in key financial metrics over the years.<BR><BR>Breakdown:<BR>In the fiscal year ending March 2025, Indian Metals reported net sales of 2,564.57 crore, a decrease from 2,780.17 crore in March 2024 and 2,676.39 crore in March 2023. The total operating income for March 2025 was the same as net sales at 2,564.57 crore. The total expenditure, excluding depreciation, was 2,034.07 crore, down from 2,193.30 crore in the previous year. This resulted in an operating profit (PBDIT) of 596.98 crore for March 2025, slightly lower than 629.09 crore in March 2024. Profit before tax was 514.11 crore, showing a marginal decrease from 516.12 crore in March 2024, while profit after tax increased to 379.32 crore from 344.34 crore. The consolidated net profit for March 2025 was 378.72 crore, up from 343.57 crore in March 2024. The company's total assets rose to 3,177.44 crore in March 2025 from 2,912.67 crore in March 2024, with total liabilities also increasing to 3,177.44 crore. Cash flow from operating activities improved to 585.00 crore in March 2025, compared to 459.00 crore in March 2024, although the net cash outflow was recorded at -44.00 crore. Overall, the financial performance indicates a mixed trend with improvements in profit metrics despite declining sales.

View full answer

Who are the top shareholders of the Indian Metals?

17-Jul-2025

The top shareholders of Indian Metals include Subhrakant Panda, Trustee of B Panda Trust, with 51.59%, followed by Litec Company Limited at 12.77%. Individual investors hold 19.16%, mutual funds account for 0.73%, and foreign institutional investors hold 3.81%, with no pledged promoter holdings reported.

The top shareholders of Indian Metals include the promoters, with Subhrakant Panda, Trustee of B Panda Trust, holding the largest stake at 51.59%. The highest public shareholder is Litec Company Limited, which owns 12.77% of the shares. Additionally, individual investors collectively hold 19.16%, while mutual funds account for 0.73% through eight schemes, and foreign institutional investors (FIIs) hold 3.81% across 74 entities. There are no pledged promoter holdings reported.

View full answer

What is the bonus history of the Indian Metals?

06-Jun-2025

Indian Metals & Ferro Alloys Ltd announced a 1:1 bonus issue, with an ex-date of January 7, 2022, and a record date of January 10, 2022, allowing shareholders to receive one additional share for each share held.

The bonus history of Indian Metals & Ferro Alloys Ltd includes a notable event where the company announced a 1:1 bonus issue. The ex-date for this bonus was January 7, 2022, and the record date was January 10, 2022. This means that shareholders on record as of the record date were entitled to receive one additional share for every share they held.

View full answer
iScoreScore
Click here to find our call on this stock
Strong Sell
Sell
Hold
Buy
Strong Buy

Dashboard

1

Poor long term growth as Net Sales has grown by an annual rate of 9.73% and Operating profit at 14.36% over the last 5 years

 
2

With ROCE of 16.1, it has a Very Expensive valuation with a 2.4 Enterprise value to Capital Employed

3

Despite the size of the company, domestic mutual funds hold only 0.24% of the company

stock-summaryMojo Parameters

Mojo Parameters

Loading Valuation Snapshot...

Stock DNA

stock-summary
Industry

Ferrous Metals

stock-summary
Market cap

INR 7,252 Cr (Small Cap)

stock-summary
P/E

14.00

stock-summary
Industry P/E

13

stock-summary
Dividend Yield

0.91%

stock-summary
Debt Equity

0.20

stock-summary
Return on Equity

15.61%

stock-summary
Price to Book

2.74

Revenue and Profits:
Net Sales:
960 Cr
(Quarterly Results - Jun 2026)
Net Profit:
192 Cr
stock-summaryTotal Returns
Total Returns (Price + Dividend) stock-summary
Dividend Yield (0.91%)
TimePeriod
Price Return
Dividend Return
Total Return
3 Months
-8.89%
0.51%
-8.38%
6 Months
6.05%
0.64%
6.69%
1 Year
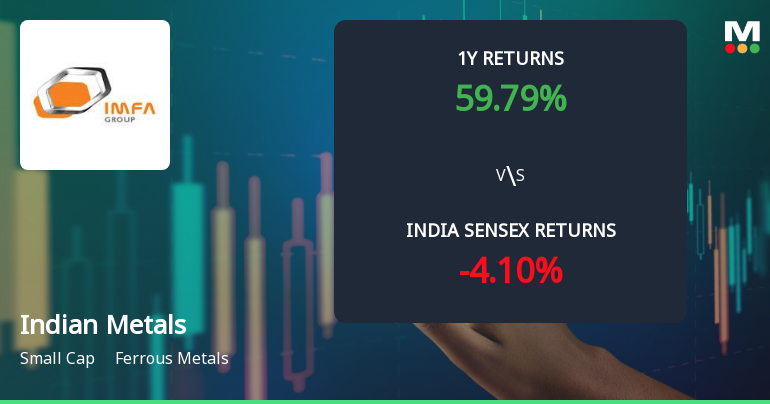
52.89%
1.28%
54.17%
2 Years
96.98%
5.06%
102.04%
3 Years
245.6%
16.15%
261.75%
4 Years
375.84%
27.68%
403.52%
5 Years
279.27%
24.20%
303.47%

Latest dividend: 7.460202604920406 per share ex-dividend date: Jul-31-2026

Risk Adjusted Returns v/s stock-summary
Returns Beta
Icon
Beta has not been calculated since enough price history is not available
stock-summaryNews & Corporate Actions

News

Indian Metals & Ferro Alloys Ltd Declines 0.97%: Technical Shifts and Valuation Concerns Shape Week

Key Events This Week

24 Aug: Stock opens at Rs.1,388.60, up 0.26% despite Sensex decline

25 Aug: Downgrade to Sell rating announced; stock falls 0.84%

26 Aug: Mixed technical signals emerge; stock recovers slightly by 0.28%

27 Aug: Technical momentum shifts mildly bullish; stock dips 0.93%

28 Aug: Week closes at Rs.1,371.50, a 0.26% gain on the day but overall weekly loss

Announcements stock-summary

Indian Metals & Ferro Alloys Limited - Updates

18-Nov-2019 | Source : NSE

Indian Metals & Ferro Alloys Limited has informed the Exchange regarding 'Announcement Under Regulation 30 of SEBI (LODR)'.

Indian Metals & Ferro Alloys Limited - Other General Purpose

01-Nov-2019 | Source : NSE

Indian Metals & Ferro Alloys Limited has informed the Exchange regarding Submission of Disclosure on Related Party Transactions.

Indian Metals & Ferro Alloys Limited - Press Release

22-Oct-2019 | Source : NSE

Indian Metals & Ferro Alloys Limited has informed the Exchange regarding a press release dated October 22, 2019, titled "

Corporate Actions stock-summary

stock-summary
BOARD MEETING

No Upcoming Board Meetings

stock-summary
DIVIDEND

Indian Metals & Ferro Alloys Ltd has declared 75% dividend, ex-date: 31 Jul 26

stock-summary
SPLITS

No Splits history available

stock-summary
BONUS

Indian Metals & Ferro Alloys Ltd has announced 1:1 bonus issue, ex-date: 07 Jan 22

stock-summary
RIGHTS

No Rights history available

stock-summaryKey Factors

Quality key factors stock-summary

Factor
Value
Sales Growth (5y)
9.73%
EBIT Growth (5y)
14.36%
EBIT to Interest (avg)
12.99
Debt to EBITDA (avg)
0.79
Net Debt to Equity (avg)
0.20
Sales to Capital Employed (avg)
1.06
Tax Ratio
23.57%
Dividend Payout Ratio
15.90%
Pledged Shares
0
Institutional Holding
4.46%
ROCE (avg)
25.07%
ROE (avg)
18.04%

Valuation key factors

Factor
Value
P/E Ratio
14
Industry P/E
13
Price to Book Value
2.62
EV to EBIT
11.43
EV to EBITDA
10.33
EV to Capital Employed
2.36
EV to Sales
2.44
PEG Ratio
0.29
Dividend Yield
0.95%
ROCE (Latest)
16.09%
ROE (Latest)
15.61%

Technicals key factors

Indicator
Weekly
Monthly
MACD
Mildly Bearish
Mildly Bearish
RSI
No Signal
No Signal
Bollinger Bands
Bearish
Mildly Bullish
Moving Averages
Mildly Bullish (Daily)
KST
Bearish
Bullish
Dow Theory
Mildly Bearish
Mildly Bearish
OBV
No Trend
Mildly Bearish
stock-summary Technical Indicator Scale: Bearish, Mildly Bearish, Sideways, Mildly Bullish, Bullish  Turned 
stock-summaryShareholding
Shareholding Snapshot : Jun 2026stock-summary
Shareholding Compare (%holding) stock-summary
Majority shareholders

Promoters

Pledged Promoter Holdings

None

Mutual Funds

Held by 8 Schemes (0.1%)

FIIs

Held by 85 FIIs (3.59%)

Promoter with highest holding

Subhrakant Panda, Trustee, B Panda Trust (51.59%)

Highest Public shareholder

Litec Company Limited (12.77%)

Individual Investors Holdings

19.05%

stock-summaryFinancial
[
  {
    "link": "quarterly",
    "btn_text": "All Quarterly Results",
    "header": "Quarterly Results Snapshot (Consolidated) - Jun'26 - QoQ",
    "rhs": [
      {
        "prefix": "Net Sales ",
        "suffix": "QoQ Growth in quarter ended Jun 2026 is 25.83% vs 8.60% in Mar 2026",
        "dir": 1
      },
      {
        "prefix": "Consolidated Net Profit ",
        "suffix": "QoQ Growth in quarter ended Jun 2026 is 86.34% vs -21.38% in Mar 2026",
        "dir": 1
      }
    ],
    "table": {
      "header": [
        "Jun'26",
        "Mar'26",
        "Change(%)"
      ],
      "body": [
        {
          "field": "Net Sales",
          "val1": "960.45",
          "val2": "763.29",
          "chgp": "25.83%",
          "chgp_class": "positive"
        },
        {
          "field": "Operating Profit (PBDIT) excl Other Income",
          "val1": "281.27",
          "val2": "159.06",
          "chgp": "76.83%",
          "chgp_class": "positive"
        },
        {
          "field": "Interest",
          "val1": "12.46",
          "val2": "11.29",
          "chgp": "10.36%",
          "chgp_class": "negative"
        },
        {
          "field": "Exceptional Items",
          "val1": "0.00",
          "val2": "0.00",
          "chgp": "",
          "chgp_class": "neutral"
        },
        {
          "field": "Consolidate Net Profit",
          "val1": "192.34",
          "val2": "103.22",
          "chgp": "86.34%",
          "chgp_class": "positive"
        },
        {
          "field": "Operating Profit Margin (Excl OI)",
          "val1": "29.29%",
          "val2": "20.84%",
          "chgp": "8.45%",
          "chgp_class": "positive"
        }
      ]
    }
  },
  {
    "link": "half-yearly",
    "btn_text": "All Half Yearly Results",
    "header": "Half Yearly Results Snapshot (Consolidated) - Sep'25",
    "rhs": [
      {
        "prefix": "Net Sales ",
        "suffix": " Growth in half year ended Sep 2025 is 0.44% vs -2.88% in Sep 2024",
        "dir": 1
      },
      {
        "prefix": "Consolidated Net Profit ",
        "suffix": " Growth in half year ended Sep 2025 is -20.29% vs 19.30% in Sep 2024",
        "dir": -1
      }
    ],
    "table": {
      "header": [
        "Sep'25",
        "Sep'24",
        "Change(%)"
      ],
      "body": [
        {
          "field": "Net Sales",
          "val1": "1,360.19",
          "val2": "1,354.20",
          "chgp": "0.44%",
          "chgp_class": "positive"
        },
        {
          "field": "Operating Profit (PBDIT) excl Other Income",
          "val1": "263.79",
          "val2": "331.79",
          "chgp": "-20.49%",
          "chgp_class": "negative"
        },
        {
          "field": "Interest",
          "val1": "15.10",
          "val2": "10.04",
          "chgp": "50.40%",
          "chgp_class": "negative"
        },
        {
          "field": "Exceptional Items",
          "val1": "0.00",
          "val2": "0.00",
          "chgp": "",
          "chgp_class": "neutral"
        },
        {
          "field": "Consolidate Net Profit",
          "val1": "189.77",
          "val2": "238.08",
          "chgp": "-20.29%",
          "chgp_class": "negative"
        },
        {
          "field": "Operating Profit Margin (Excl OI)",
          "val1": "19.39%",
          "val2": "24.50%",
          "chgp": "-5.11%",
          "chgp_class": "negative"
        }
      ]
    }
  },
  {
    "link": "nine-monthly",
    "btn_text": "All Nine Monthly Results",
    "header": "Nine Monthly Results Snapshot (Consolidated) - Dec'25",
    "rhs": [
      {
        "prefix": "Net Sales ",
        "suffix": "YoY Growth in nine months ended Dec 2025 is 3.28% vs -3.95% in Dec 2024",
        "dir": 1
      },
      {
        "prefix": "Consolidated Net Profit ",
        "suffix": "YoY Growth in nine months ended Dec 2025 is -3.12% vs 7.51% in Dec 2024",
        "dir": -1
      }
    ],
    "table": {
      "header": [
        "Dec'25",
        "Dec'24",
        "Change(%)"
      ],
      "body": [
        {
          "field": "Net Sales",
          "val1": "2,063.02",
          "val2": "1,997.42",
          "chgp": "3.28%",
          "chgp_class": "positive"
        },
        {
          "field": "Operating Profit (PBDIT) excl Other Income",
          "val1": "428.10",
          "val2": "459.97",
          "chgp": "-6.93%",
          "chgp_class": "negative"
        },
        {
          "field": "Interest",
          "val1": "24.37",
          "val2": "18.27",
          "chgp": "33.39%",
          "chgp_class": "negative"
        },
        {
          "field": "Exceptional Items",
          "val1": "0.00",
          "val2": "0.00",
          "chgp": "",
          "chgp_class": "neutral"
        },
        {
          "field": "Consolidate Net Profit",
          "val1": "321.06",
          "val2": "331.40",
          "chgp": "-3.12%",
          "chgp_class": "negative"
        },
        {
          "field": "Operating Profit Margin (Excl OI)",
          "val1": "20.75%",
          "val2": "23.03%",
          "chgp": "-2.28%",
          "chgp_class": "negative"
        }
      ]
    }
  },
  {
    "link": "annual",
    "btn_text": "All Annual Results",
    "header": "Annual Results Snapshot (Consolidated) - Mar'26",
    "rhs": [
      {
        "prefix": "Net Sales ",
        "suffix": "YoY Growth in year ended Mar 2026 is 10.21% vs -7.75% in Mar 2025",
        "dir": 1
      },
      {
        "prefix": "Consolidated Net Profit ",
        "suffix": "YoY Growth in year ended Mar 2026 is 12.03% vs 10.23% in Mar 2025",
        "dir": 1
      }
    ],
    "table": {
      "header": [
        "Mar'26",
        "Mar'25",
        "Change(%)"
      ],
      "body": [
        {
          "field": "Net Sales",
          "val1": "2,826.31",
          "val2": "2,564.57",
          "chgp": "10.21%",
          "chgp_class": "positive"
        },
        {
          "field": "Operating Profit (PBDIT) excl Other Income",
          "val1": "587.16",
          "val2": "530.50",
          "chgp": "10.68%",
          "chgp_class": "positive"
        },
        {
          "field": "Interest",
          "val1": "35.66",
          "val2": "28.27",
          "chgp": "26.14%",
          "chgp_class": "negative"
        },
        {
          "field": "Exceptional Items",
          "val1": "0.00",
          "val2": "0.00",
          "chgp": "",
          "chgp_class": "neutral"
        },
        {
          "field": "Consolidate Net Profit",
          "val1": "424.28",
          "val2": "378.72",
          "chgp": "12.03%",
          "chgp_class": "positive"
        },
        {
          "field": "Operating Profit Margin (Excl OI)",
          "val1": "20.77%",
          "val2": "20.69%",
          "chgp": "0.08%",
          "chgp_class": "positive"
        }
      ]
    }
  }
]

Quarterly Results Snapshot (Consolidated) - Jun'26 - QoQstock-summary

Jun'26
Mar'26
Change(%)
Net Sales
960.45
763.29
25.83%
Operating Profit (PBDIT) excl Other Income
281.27
159.06
76.83%
Interest
12.46
11.29
10.36%
Exceptional Items
0.00
0.00
Consolidate Net Profit
192.34
103.22
86.34%
Operating Profit Margin (Excl OI)
29.29%
20.84%
8.45%
Values in Rs Cr.
Direction Arrows
Net Sales

QoQ Growth in quarter ended Jun 2026 is 25.83% vs 8.60% in Mar 2026

Direction Arrows
Consolidated Net Profit

QoQ Growth in quarter ended Jun 2026 is 86.34% vs -21.38% in Mar 2026

Half Yearly Results Snapshot (Consolidated) - Sep'25stock-summary

Sep'25
Sep'24
Change(%)
Net Sales
1,360.19
1,354.20
0.44%
Operating Profit (PBDIT) excl Other Income
263.79
331.79
-20.49%
Interest
15.10
10.04
50.40%
Exceptional Items
0.00
0.00
Consolidate Net Profit
189.77
238.08
-20.29%
Operating Profit Margin (Excl OI)
19.39%
24.50%
-5.11%
Values in Rs Cr.
Direction Arrows
Net Sales

Growth in half year ended Sep 2025 is 0.44% vs -2.88% in Sep 2024

Direction Arrows
Consolidated Net Profit

Growth in half year ended Sep 2025 is -20.29% vs 19.30% in Sep 2024

Nine Monthly Results Snapshot (Consolidated) - Dec'25stock-summary

Dec'25
Dec'24
Change(%)
Net Sales
2,063.02
1,997.42
3.28%
Operating Profit (PBDIT) excl Other Income
428.10
459.97
-6.93%
Interest
24.37
18.27
33.39%
Exceptional Items
0.00
0.00
Consolidate Net Profit
321.06
331.40
-3.12%
Operating Profit Margin (Excl OI)
20.75%
23.03%
-2.28%
Values in Rs Cr.
Direction Arrows
Net Sales

YoY Growth in nine months ended Dec 2025 is 3.28% vs -3.95% in Dec 2024

Direction Arrows
Consolidated Net Profit

YoY Growth in nine months ended Dec 2025 is -3.12% vs 7.51% in Dec 2024

Annual Results Snapshot (Consolidated) - Mar'26stock-summary

Mar'26
Mar'25
Change(%)
Net Sales
2,826.31
2,564.57
10.21%
Operating Profit (PBDIT) excl Other Income
587.16
530.50
10.68%
Interest
35.66
28.27
26.14%
Exceptional Items
0.00
0.00
Consolidate Net Profit
424.28
378.72
12.03%
Operating Profit Margin (Excl OI)
20.77%
20.69%
0.08%
Values in Rs Cr.
Direction Arrows
Net Sales

YoY Growth in year ended Mar 2026 is 10.21% vs -7.75% in Mar 2025

Direction Arrows
Consolidated Net Profit

YoY Growth in year ended Mar 2026 is 12.03% vs 10.23% in Mar 2025

stock-summaryCompany CV
About Indian Metals & Ferro Alloys Ltd stock-summary
stock-summary
Indian Metals & Ferro Alloys Ltd
Small Cap
Ferrous Metals
Indian Metals & Ferro Alloys Limited (IMFA) established in November 20, 1961, is a leading, fully integrated producer of ferro chrome in India. Located in the State of Odisha known for its natural resources, the Company operates 3 manufacturing units at Therubali, Kalinganagar and Choudwar in Odisha with a total production capacity of 384,000 TPA and a smelting capacity of 256 MVA. It also enjoys two captive mines (in Sukinda and Mahargiri) with a capacity of 6.51 lakh TPA.
Company Coordinates stock-summary
Company Details
IMFA Building Bhomikhal, P O Rasulgarh Bhubaneswar Orissa : 751010
stock-summary
Tel: 91-674-2580100/25/3051000
stock-summary
mail@imfa.in
Registrar Details
Indian Metals & Ferro Alloys Ltd., I M F A Building, Bomikhal, P O Rasulgarh, Bhubaneswar