
Compare I O B with Similar Stocks
Dashboard
Strong lending practices with low Gross NPA ratio of 1.42%
Strong Long Term Fundamental Strength with a 44.33% CAGR growth in Net Profits
Healthy long term growth as Net profit has grown by an annual rate of 44.33%
With a growth in Interest of 3.87%, the company declared Very Positive results in Mar 26
With ROA of 1.1, it has a Very Attractive valuation with a 1.7 Price to Book Value
Majority shareholders : Promoters
Below par performance in long term as well as near term
Total Returns (Price + Dividend) 
Latest dividend: 0.5 per share ex-dividend date: Jun-19-2014
Risk Adjusted Returns v/s
Returns Beta

News

Indian Overseas Bank Technical Momentum Shifts Amid Mixed Market Signals
Indian Overseas Bank (IOB) has experienced a notable shift in its technical momentum, moving from a mildly bearish stance to a more pronounced bearish trend. Despite some mildly bullish weekly indicators, the overall technical landscape remains cautious as key metrics such as moving averages and Bollinger Bands signal downward pressure. This article analyses the recent technical parameter changes, price momentum, and how these signals align with the bank’s broader market performance and investor sentiment.
Read full news article
Indian Overseas Bank Technical Momentum Shifts Amid Mixed Market Signals
Indian Overseas Bank (IOB) has experienced a subtle yet notable shift in its technical momentum, moving from a bearish stance to a mildly bearish outlook. This transition is underscored by a complex interplay of technical indicators including MACD, RSI, Bollinger Bands, and moving averages, reflecting a nuanced market sentiment for this mid-cap public sector bank.
Read full news article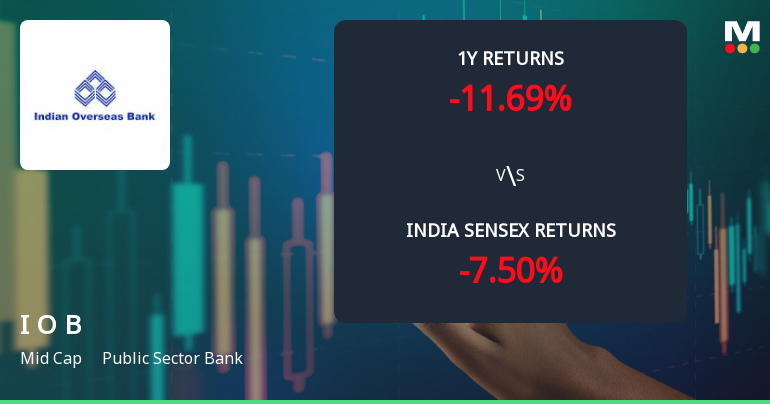
Indian Overseas Bank Technical Momentum Shifts Amid Mixed Indicator Signals
Indian Overseas Bank (IOB) has experienced a notable shift in its technical momentum, moving from a mildly bearish stance to a more pronounced bearish trend. Despite some mildly bullish signals on weekly charts, the overall technical landscape remains cautious, reflecting mixed signals from key indicators such as MACD, RSI, Bollinger Bands, and moving averages. This nuanced technical picture warrants close attention from investors seeking to navigate the public sector banking space.
Read full news article Announcements
Indian Overseas Bank - Interest Rates Updates
09-Dec-2019 | Source : NSEIndian Overseas Bank has informed the Exchange regarding Interest Rates Updates
Indian Overseas Bank - Clarification
28-Nov-2019 | Source : NSEIndian Overseas Bank with respect to announcement dated 27-Nov-2019, regardingá penalty levied by Reserve Bonk of lndia. On basis of above the Company is required to clarify following: 1. Brief details of litigation viz. name(s) of the opposing party, court/ tribunal/agency where litigation is filed, brief details of dispute/litigation. The response of the Company is awaited.
Indian Overseas Bank - Updates
27-Nov-2019 | Source : NSEIndian Overseas Bank has informed the Exchange regarding 'Disclosure under Regulation 30 of Securities Exchange Board of India (Listing Obligations and Disclosure Requirements) Regulations, 2015'.
Corporate Actions

No Upcoming Board Meetings

Indian Overseas Bank has declared 5% dividend, ex-date: 19 Jun 14

No Splits history available

No Bonus history available

No Rights history available
Quality key factors
Valuation key factors
Technicals key factors
 Technical Indicator Scale: Bearish, Mildly Bearish, Sideways, Mildly Bullish, Bullish Turned
 Shareholding Snapshot : Mar 2026
Shareholding Compare (%holding)
Promoters
None
Held by 16 Schemes (0.22%)
Held by 44 FIIs (0.43%)
President Of India (92.44%)
Life Insurance Corporation Of India (3.7%)
2.4%
Quarterly Results Snapshot (Standalone) - Mar'26 - QoQ

QoQ Growth in quarter ended Mar 2026 is 3.87% vs 4.12% in Dec 2025
QoQ Growth in quarter ended Mar 2026 is 10.28% vs 11.31% in Dec 2025
Half Yearly Results Snapshot (Standalone) - Sep'25
Growth in half year ended Sep 2025 is 13.81% vs 19.03% in Sep 2024

Growth in half year ended Sep 2025 is 65.78% vs 25.34% in Sep 2024
Nine Monthly Results Snapshot (Standalone) - Dec'25
YoY Growth in nine months ended Dec 2025 is 14.19% vs 17.66% in Dec 2024
YoY Growth in nine months ended Dec 2025 is 62.14% vs 23.61% in Dec 2024
Annual Results Snapshot (Standalone) - Mar'26
YoY Growth in year ended Mar 2026 is 13.38% vs 16.97% in Mar 2025
YoY Growth in year ended Mar 2026 is 56.18% vs 25.57% in Mar 2025
About Indian Overseas Bank

Company Coordinates


