
Compare I R C T C with Similar Stocks
Dashboard
Poor long term growth as Operating profit has grown by an annual rate 7.16% of over the last 5 years
Flat results in Mar 26
With ROE of 32.1, it has a Expensive valuation with a 9.6 Price to Book Value
Falling Participation by Institutional Investors
Below par performance in long term as well as near term
Stock DNA
Tour, Travel Related Services
INR 41,280 Cr (Mid Cap)
30.00
36
1.83%
-0.65
32.05%
9.62
Total Returns (Price + Dividend) 
Latest dividend: 3.5000000000000004 per share ex-dividend date: Feb-20-2026
Risk Adjusted Returns v/s
Returns Beta

News
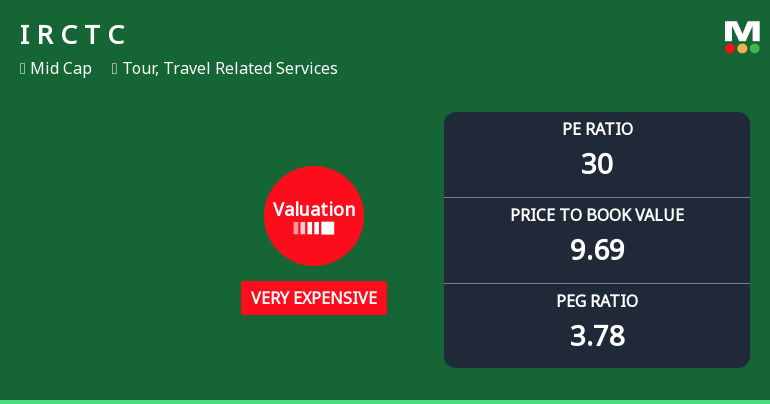
Indian Railway Catering & Tourism Corporation Ltd Valuation Shifts to Very Expensive Amid Market Underperformance
Indian Railway Catering & Tourism Corporation Ltd (IRCTC) has seen a marked shift in its valuation parameters, moving from an expensive to a very expensive rating. Despite a modest day gain of 0.45%, the stock’s price-to-earnings (P/E) and price-to-book value (P/BV) ratios have surged, raising questions about its price attractiveness relative to historical and peer benchmarks.
Read full news article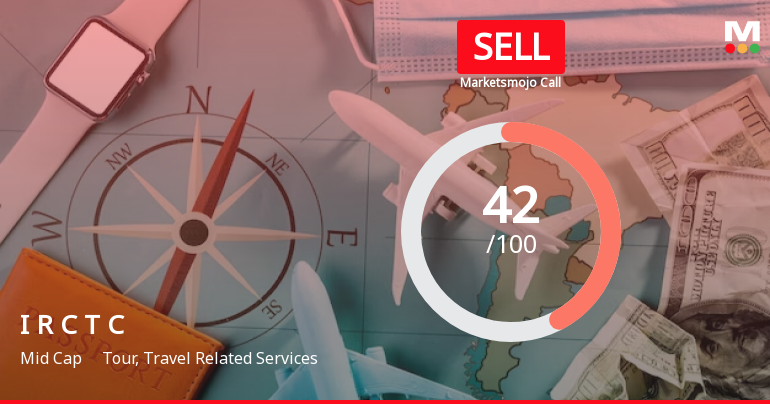
Indian Railway Catering & Tourism Corporation Ltd is Rated Sell
Indian Railway Catering & Tourism Corporation Ltd is rated 'Sell' by MarketsMOJO. This rating was last updated on 27 May 2026, reflecting a reassessment of the stock’s outlook. However, all fundamentals, returns, and financial metrics discussed below are current as of 19 June 2026, providing investors with the latest perspective on the company’s performance and valuation.
Read full news article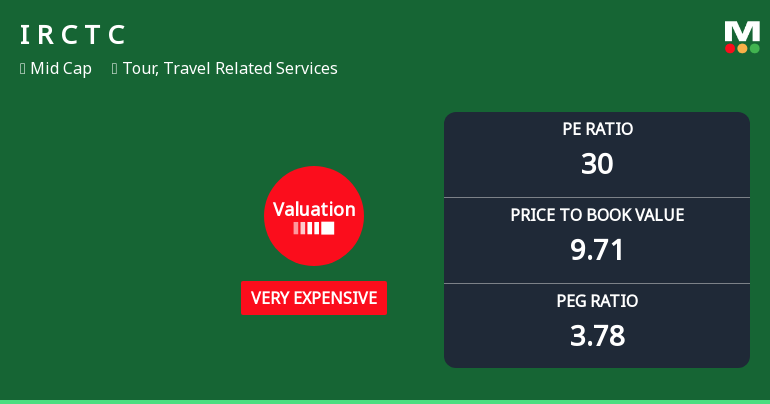
Indian Railway Catering & Tourism Corporation Ltd: Valuation Shifts Signal Heightened Price Risk
Indian Railway Catering & Tourism Corporation Ltd (IRCTC) has seen a marked shift in its valuation parameters, moving from an expensive to a very expensive rating, despite ongoing challenges in market performance. This article analyses the recent changes in key valuation metrics such as the price-to-earnings (P/E) and price-to-book value (P/BV) ratios, compares them with historical and peer averages, and assesses the implications for investors amid a backdrop of subdued returns relative to the broader Sensex.
Read full news article Announcements
Announcement under Regulation 30 (LODR)-Change in Management
19-Jun-2026 | Source : BSEPlease find attached herewith intimation regarding change in Senior Managment.
Announcement under Regulation 30 (LODR)-Change in Directorate
15-Jun-2026 | Source : BSEPlease find attached herewith intimation regarding Change in Directorate.
Announcement under Regulation 30 (LODR)-Change in Management
15-Jun-2026 | Source : BSEPlease find attached herewith intimation regarding Change in CFO and Senior Management.
Corporate Actions

No Upcoming Board Meetings

Indian Railway Catering & Tourism Corporation Ltd has declared 175% dividend, ex-date: 20 Feb 26

Indian Railway Catering & Tourism Corporation Ltd has announced 2:10 stock split, ex-date: 28 Oct 21

No Bonus history available

No Rights history available
Quality key factors
Valuation key factors
Technicals key factors
 Technical Indicator Scale: Bearish, Mildly Bearish, Sideways, Mildly Bullish, Bullish Turned
 Shareholding Snapshot : Mar 2026
Shareholding Compare (%holding)
Promoters
None
Held by 22 Schemes (3.27%)
Held by 184 FIIs (4.86%)
The President Of India (62.4%)
Life Insurance Corporation Of India (10.73%)
16.52%
Quarterly Results Snapshot (Consolidated) - Mar'26 - QoQ

QoQ Growth in quarter ended Mar 2026 is 0.71% vs 26.48% in Dec 2025
QoQ Growth in quarter ended Mar 2026 is -17.23% vs 15.29% in Dec 2025
Half Yearly Results Snapshot (Consolidated) - Sep'25
Growth in half year ended Sep 2025 is 5.69% vs 9.46% in Sep 2024
Growth in half year ended Sep 2025 is 9.28% vs 16.83% in Sep 2024
Nine Monthly Results Snapshot (Consolidated) - Dec'25

YoY Growth in nine months ended Dec 2025 is 10.24% vs 9.48% in Dec 2024
YoY Growth in nine months ended Dec 2025 is 11.54% vs 15.69% in Dec 2024
Annual Results Snapshot (Consolidated) - Mar'26
YoY Growth in year ended Mar 2026 is 11.55% vs 9.73% in Mar 2025
YoY Growth in year ended Mar 2026 is 5.97% vs 18.34% in Mar 2025
About Indian Railway Catering & Tourism Corporation Ltd

Company Coordinates


