Indo Tech.Trans.

  • Market Cap: Small Cap
  • Industry: Heavy Electrical Equipment
  • ISIN: INE332H01014
  • NSEID: INDOTECH
  • BSEID: 532717
INR
3,862.70
-39 (-1.0%)
BSENSE

Aug 24, 03:30 PM

BSE+NSE Vol: 34.28 k

  • Price Points
  • Score
  • Mojo Parameters
  • Total Return
  • News and Corporate Actions
  • Key factors
  • Shareholding
  • Financials
  • CompanyCV
stock-summaryPrice Point
High/Low

1Day

52 Week

Valuation
Technical
Day's Volume

CASH

34.28 k (-31.22%) Volume

Shareholding (Jun 2026)

FII

0.28%

Held by 14 FIIs

DII

0.05%

Held by 0 DIIs

Promoter

72.18%

Why is Indo Tech Transformers Ltd falling/rising?

25-Aug-2026

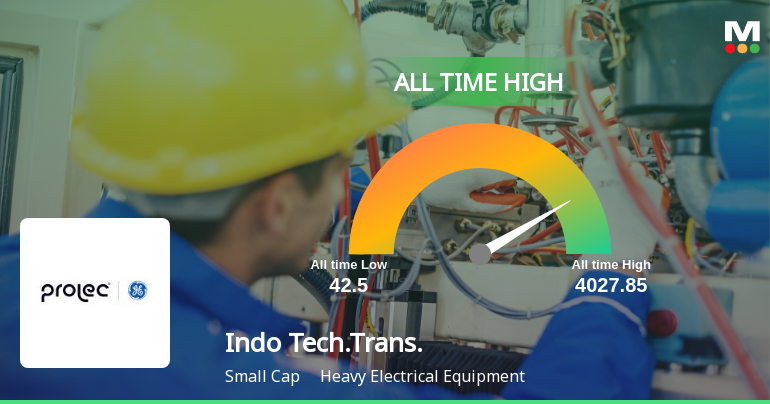
As of 24-Aug, Indo Tech Transformers Ltd's stock price is Rs 3,862.70, down 1.0% today but up 147.45% year-to-date. The company is net-debt free and has shown strong long-term growth, despite a recent decline and underperformance against its sector.

As of 24-Aug, Indo Tech Transformers Ltd's stock price is currently at Rs 3,862.70, reflecting a decrease of Rs 39.0 or 1.0%. Despite this decline, the stock has shown strong performance over various periods, including a 7.47% increase over the past week and a remarkable 147.45% rise year-to-date. The stock reached a new 52-week and all-time high of Rs 4,035.3 earlier today, indicating significant upward momentum in the recent past.<BR><BR>However, the stock has underperformed its sector by 0.74% today and has experienced a trend reversal after two consecutive days of gains, contributing to the current decline. Additionally, while the stock is trading above its moving averages, the weighted average price suggests that more volume was traded closer to the low price, which may indicate some selling pressure.<BR><BR>On a positive note, the company remains net-debt free and has demonstrated healthy long-term growth, with net sales increasing at an annual rate of 31.86% and operating profit rising significantly. The company has also reported positive results for the last eight consecutive quarters, further supporting its strong fundamentals. Despite the current price drop, the overall long-term performance remains robust, with the stock outperforming benchmarks like the BSE500 over multiple time frames.

View full answer

Who are in the management team of Indo Tech.Trans.?

14-Aug-2026

The management team of Indo Tech.Trans. includes Shridhar Gokhale (Whole-time Director), N Visweswara Reddy (Chairman), and several independent directors, among others, who guide the company's strategic direction and ensure regulatory compliance.

The management team of Indo Tech.Trans. includes the following individuals:<BR><BR>1. **Shridhar Gokhale** - Whole-time Director<BR>2. **Ajay Kumar Dhagat** - Independent Director<BR>3. **Sutanu Behuria** - Independent Director<BR>4. **N Visweswara Reddy** - Chairman (Non-Executive)<BR>5. **K Sharat Chandra** - Director<BR>6. **Leena M Sathyanarayanan** - Independent Director<BR>7. **Manikandan M** - Company Secretary & Compliance Officer<BR>8. **Sudheer Vennam** - Director<BR><BR>This team plays a crucial role in guiding the company's strategic direction and ensuring compliance with regulatory standards.

View full answer

What does Indo Tech.Trans. do?

14-Aug-2026

Indo Tech Transformers Ltd manufactures power and distribution transformers and mobile sub-station transformers, operating within the Heavy Electrical Equipment industry as a Small Cap company. As of June 2026, it reported net sales of 228 Cr and a net profit of 26 Cr, with a market cap of INR 3,675 Cr.

Overview:<BR>Indo Tech Transformers Ltd is engaged in the manufacturing of power and distribution transformers, special application transformers, and mobile sub-station transformers within the Heavy Electrical Equipment industry, categorized as a Small Cap company.<BR><BR>History:<BR>Indo Tech Transformers Ltd is the flagship of the Indo Tech Group and has been operational for several years, with its latest reported quarterly results for net sales and profit being for June 2026.<BR><BR>Financial Snapshot:<BR>Most recent Net Sales: 228 Cr (Quarterly Results - Jun 2026) <BR>Most recent Net Profit: 26 Cr (Quarterly Results - Jun 2026) <BR>Market-cap value: INR 3,675 Cr (Small Cap)<BR><BR>Key Metrics:<BR>P/E: 38.00 <BR>Industry P/E: 43 <BR>Dividend Yield: 0.00% <BR>Debt-Equity: -0.30 <BR>Return on Equity: 35.37% <BR>Price-to-Book: 13.44<BR><BR>Contact Details:<BR>Address: SNo 153-210 Illuppapattu Villa, Near Rajakulam Kancheepuram Tamil Nadu : 631561 <BR>Email: investor@prolec-geindia.com <BR>Website: http://www.prolecge.in

View full answer

Who are the peers of the Indo Tech.Trans.?

14-Aug-2026

Indo Tech.Trans.'s peers include T R I L, Transrail Light, Skipper, GE Power, Bajel Projects, Exicom Tele-Sys., Vikran Engg., KP Green Engg., and Jyoti Structures. In terms of management risk, growth, and capital structure, Indo Tech.Trans. shows average management risk and growth, with an excellent capital structure, and has a 1-year return of 90.65%.

Peers: The peers of Indo Tech.Trans. are T R I L, Transrail Light, Skipper, GE Power, Bajel Projects, Exicom Tele-Sys., Vikran Engg., KP Green Engg., and Jyoti Structures.<BR><BR>Quality Snapshot: Excellent management risk is observed at T R I L and Skipper, while Average management risk is found at Transrail Light, GE Power, Indo Tech.Trans., Bajel Projects, Vikran Engg., and KP Green Engg., and Below Average management risk is noted at Exicom Tele-Sys. and Jyoti Structures. For growth, Excellent growth is seen at T R I L, Transrail Light, Skipper, Indo Tech.Trans., Bajel Projects, and KP Green Engg., while Average growth is found at Vikran Engg. and Jyoti Structures, and Below Average growth is noted at GE Power and Exicom Tele-Sys. In terms of Capital Structure, Excellent capital structure is present at Indo Tech.Trans., Good capital structure is observed at T R I L, Transrail Light, Skipper, Vikran Engg., and KP Green Engg., while Average capital structure is found at Bajel Projects and Below Average capital structure is noted at GE Power, Exicom Tele-Sys., and Jyoti Structures.<BR><BR>Return Snapshot: The peer with the highest 1-year return is GE Power at 138.46%, while the peer with the lowest is T R I L at -43.18%. Indo Tech.Trans. has a 1-year return of 90.65%, which is significantly higher than T R I L but lower than GE Power. Additionally, the six-month return is negative for Vikran Engg., KP Green Engg., and Jyoti Structures.

View full answer

How big is Indo Tech.Trans.?

14-Aug-2026

As of 14th August, Indo Tech Transformers Ltd has a market capitalization of 3,785.50 Cr, with recent Net Sales of 846.04 Cr and a Net Profit of 99.30 Cr.

As of 14th August, Indo Tech Transformers Ltd has a market capitalization of 3,785.50 Cr, categorizing it as a Small Cap company.<BR><BR>In the latest 4 quarters, the company reported Net Sales of 846.04 Cr and a Net Profit of 99.30 Cr.<BR><BR>The latest annual period for the balance sheet is March 2025, with Shareholder's Funds amounting to 280.75 Cr and Total Assets of 433.80 Cr.

View full answer

Should I buy, sell or hold Indo Tech Transformers Ltd?

13-Aug-2026

Has Indo Tech Transformers Ltd declared dividend?

13-Aug-2026

Yes, Indo Tech Transformers Ltd has declared a 100% dividend, with an ex-date of September 23, 2026. Despite a low dividend yield of 0%, the company has shown strong price appreciation, resulting in significant total returns over various periods.

Indo Tech Transformers Ltd has declared a 100% dividend.<BR><BR>Dividend Details:<BR>- Percentage announced: 100%<BR>- Ex-date: 23 Sep 26<BR><BR>Dividend Yield: 0%<BR><BR>Total Returns by Period:<BR>In the last 3 months, the price return was 30.43%, the dividend return was 0.38%, resulting in a total return of 30.81%.<BR><BR>Over the past 6 months, the price return reached 150.94%, with a dividend return of 0.76%, leading to a total return of 151.7%.<BR><BR>For the 1-year period, the price return was 90.65%, the dividend return was 0.53%, culminating in a total return of 91.18%.<BR><BR>In the last 2 years, the price return stood at 83.66%, with a dividend return of 0.50%, resulting in a total return of 84.16%.<BR><BR>Over the past 3 years, the price return was an impressive 635.85%, with a dividend return of 2.23%, leading to a total return of 638.08%.<BR><BR>In the last 4 years, the price return reached 1578.11%, with a dividend return of 5.19%, resulting in a total return of 1583.3%.<BR><BR>For the 5-year period, the price return was 1769.56%, with a dividend return of 6.25%, culminating in a total return of 1775.81%.<BR><BR>Overall, Indo Tech Transformers Ltd has declared a substantial dividend, and the total returns over various periods indicate strong performance, particularly in price appreciation, despite a low dividend yield.

View full answer

Are Indo Tech Transformers Ltd latest results good or bad?

21-May-2026

Indo Tech Transformers Ltd's latest results show strong revenue growth with record net sales of ₹238.99 crores, but a decline in net profit and operating margin raises concerns about profitability sustainability. Investors should monitor these challenges closely.

Indo Tech Transformers Ltd's latest results present a mixed picture. On one hand, the company achieved record net sales of ₹238.99 crores in Q4 FY26, marking a significant 21.75% increase from the previous quarter and a 15.98% rise year-on-year. This reflects strong demand for its transformer products and effective order execution.<BR><BR>However, the profitability metrics raise concerns. The net profit for the quarter was ₹23.92 crores, which represents a decline of 3.94% compared to the previous quarter. Additionally, the operating margin decreased sharply from 16.81% to 13.54%, indicating potential challenges in cost management or pricing power.<BR><BR>Overall, while the revenue growth is commendable and showcases the company's operational capabilities, the decline in profit and margin compression signal potential issues that need to be monitored closely. Investors may view the results as a cautionary sign regarding the sustainability of profitability moving forward.

View full answer

Is Indo Tech.Trans. overvalued or undervalued?

21-Nov-2025

As of November 20, 2025, Indo Tech.Trans. is considered undervalued with an attractive valuation grade, reflected by its lower PE ratio of 21.72 compared to peers like Larsen & Toubro and Afcons Infrastructure, despite a year-to-date stock price decline and strong three-year returns outperforming the Sensex.

As of 20 November 2025, the valuation grade for Indo Tech.Trans. has moved from fair to attractive, indicating a more favorable assessment of the company's financial health. The company is currently considered undervalued, given its PE ratio of 21.72, an EV to EBITDA ratio of 17.46, and a PEG ratio of 0.53, which suggests strong growth potential relative to its price. <BR><BR>In comparison to its peers, Indo Tech.Trans. shows a more attractive valuation than Larsen & Toubro, which has a PE ratio of 34.61, and Afcons Infrastructure, which has a PE ratio of 29.17. Notably, while Indo Tech.Trans. has experienced a significant decline in stock price year-to-date, it has delivered impressive returns over a three-year period, outperforming the Sensex considerably.

View full answer

Is Indo Tech.Trans. technically bullish or bearish?

13-Nov-2025

As of November 12, 2025, the trend is mildly bearish, with mixed signals from indicators like the MACD and KST, suggesting downward pressure and underperformance against the Sensex.

As of 12 November 2025, the technical trend has changed from bearish to mildly bearish. The current stance is mildly bearish, driven by the weekly MACD and KST showing mild bullishness, while the monthly MACD and KST indicate mild bearishness. The Bollinger Bands and daily moving averages are bearish, suggesting downward pressure. The Dow Theory presents a mixed view with weekly mildly bearish and monthly mildly bullish signals. Overall, the indicators reflect a lack of strong bullish momentum, with the stock underperforming against the Sensex across multiple time frames.

View full answer

How has been the historical performance of Indo Tech.Trans.?

13-Nov-2025

Indo Tech.Trans. has shown significant growth in financial performance, with net sales increasing from 206.00 Cr in Mar'21 to 611.78 Cr in Mar'25, and profit after tax rising from 6.29 Cr to 63.88 Cr in the same period. The company's operating profit and earnings per share also improved markedly, reflecting enhanced operational efficiency and financial health.

Answer:<BR>The historical performance of Indo Tech.Trans. shows a significant upward trend in key financial metrics over the years.<BR><BR>Breakdown:<BR>Indo Tech.Trans. has demonstrated strong growth in net sales, increasing from 206.00 Cr in Mar'21 to 611.78 Cr in Mar'25. Total operating income followed a similar trajectory, reaching 611.78 Cr in Mar'25, up from 370.91 Cr in Mar'23. The company's total expenditure also rose, but at a slower pace, from 197.59 Cr in Mar'21 to 535.65 Cr in Mar'25, leading to an operating profit (PBDIT) of 92.57 Cr in Mar'25, compared to just 11.33 Cr in Mar'21. Profit before tax surged to 85.98 Cr in Mar'25 from 6.36 Cr in Mar'21, while profit after tax reached 63.88 Cr, a significant increase from 6.29 Cr in Mar'21. The earnings per share (EPS) improved dramatically from 5.92 in Mar'21 to 60.15 in Mar'25. On the balance sheet, total assets grew from 201.93 Cr in Mar'20 to 433.80 Cr in Mar'25, with total liabilities also increasing but at a lower rate, resulting in a healthier equity capital position. Cash flow from operating activities turned positive, reaching 55.00 Cr in Mar'25, compared to a negative cash flow in previous years, indicating improved operational efficiency and financial health.

View full answer

When is the next results date for Indo Tech.Trans.?

06-Aug-2025

Indo Tech.Trans. will declare its results on 13 August 2025.

Indo Tech.Trans. will declare its results on 13 August 2025.

View full answer

Who are the top shareholders of the Indo Tech.Trans.?

17-Jul-2025

The top shareholders of Indo Tech.Trans. include Shirdi Sai Electricals Limited with 75.0%, individual investors holding 19.68%, and minimal stakes from mutual funds (0.05%) and foreign institutional investors (0.25%). There are no significant public shareholders.

The top shareholders of Indo Tech.Trans. primarily consist of promoters, with Shirdi Sai Electricals Limited holding the largest share at 75.0%. Additionally, individual investors own 19.68% of the company. Other shareholders include mutual funds, which hold a minimal 0.05% through one scheme, and foreign institutional investors (FIIs), who collectively hold 0.25% across 12 different entities. There are no significant public shareholders listed.

View full answer
iScoreScore
Click here to find our call on this stock
Strong Sell
Sell
Hold
Buy
Strong Buy

Dashboard

1

The company is Net-Debt Free

 
2

Healthy long term growth as Net Sales has grown by an annual rate of 31.86% and Operating profit at 111.19%

 
3

The company has declared Positive results for the last 8 consecutive quarters

4

With ROE of 35.4, it has a Very Expensive valuation with a 14.6 Price to Book Value

5

80.26% of Promoter Shares are Pledged

6

Market Beating performance in long term as well as near term

stock-summaryMojo Parameters

Mojo Parameters

Loading Valuation Snapshot...

Stock DNA

stock-summary
Industry

Heavy Electrical Equipment

stock-summary
Market cap

INR 4,238 Cr (Small Cap)

stock-summary
P/E

41.00

stock-summary
Industry P/E

43

stock-summary
Dividend Yield

0.00%

stock-summary
Debt Equity

-0.30

stock-summary
Return on Equity

35.37%

stock-summary
Price to Book

14.65

Revenue and Profits:
Net Sales:
228 Cr
(Quarterly Results - Jun 2026)
Net Profit:
26 Cr
stock-summaryTotal Returns
Total Returns (Price + Dividend) stock-summary
Dividend Yield (0%)
TimePeriod
Price Return
Dividend Return
Total Return
3 Months
66.96%
0.39%
67.35%
6 Months
155.27%
0.63%
155.9%
1 Year
106.8%
0.55%
107.35%
2 Years
92.29%
0.51%
92.8%
3 Years
765.79%
2.37%
768.16%
4 Years
1980.64%
4.25%
1984.89%
5 Years
2176.19%
6.49%
2182.68%

Indo Tech.Trans. for the last several years.

Risk Adjusted Returns v/s stock-summary
Returns Beta
Icon
Beta has not been calculated since enough price history is not available
stock-summaryNews & Corporate Actions

Announcements stock-summary

Announcement under Regulation 30 (LODR)-Credit Rating

17-Aug-2026 | Source : BSE

Intimation of revision in credit rating dated August 17 2026

Announcement under Regulation 30 (LODR)-Newspaper Publication

14-Aug-2026 | Source : BSE

Newspaper publication in page 12 of Financial Express and Page 5 of Makkal Kural dated August 13 2026 on Financial Results for the quarter ended June 30 2026

Announcement under Regulation 30 (LODR)-Meeting Updates

12-Aug-2026 | Source : BSE

Approval and recommendation of Indo-Tech Transformers Limited Employees Stock Option Plan 2026 (ITTL ESOP 2026) to shareholders

Corporate Actions stock-summary

stock-summary
BOARD MEETING

No Upcoming Board Meetings

stock-summary
DIVIDEND

Indo Tech Transformers Ltd has declared 100% dividend, ex-date: 16 Sep 26

stock-summary
SPLITS

No Splits history available

stock-summary
BONUS

No Bonus history available

stock-summary
RIGHTS

No Rights history available

stock-summaryKey Factors

Quality key factors stock-summary

Factor
Value
Sales Growth (5y)
31.86%
EBIT Growth (5y)
111.19%
EBIT to Interest (avg)
26.40
Debt to EBITDA (avg)
0.10
Net Debt to Equity (avg)
-0.30
Sales to Capital Employed (avg)
1.86
Tax Ratio
25.36%
Dividend Payout Ratio
0
Pledged Shares
80.26%
Institutional Holding
0.34%
ROCE (avg)
11.80%
ROE (avg)
15.54%

Valuation key factors

Factor
Value
P/E Ratio
41
Industry P/E
43
Price to Book Value
14.60
EV to EBIT
32.72
EV to EBITDA
31.34
EV to Capital Employed
20.50
EV to Sales
4.74
PEG Ratio
1.44
Dividend Yield
NA
ROCE (Latest)
36.59%
ROE (Latest)
35.37%

Technicals key factors

Indicator
Weekly
Monthly
MACD
Bullish
Bullish
RSI
No Signal
No Signal
Bollinger Bands
Mildly Bullish
Bullish
Moving Averages
Bullish (Daily)
KST
Mildly Bearish
Mildly Bearish
Dow Theory
Bullish
Bullish
OBV
No Trend
Bullish
stock-summary Technical Indicator Scale: Bearish, Mildly Bearish, Sideways, Mildly Bullish, Bullish  Turned 
stock-summaryShareholding
Shareholding Snapshot : Jun 2026stock-summary
Shareholding Compare (%holding) stock-summary
Majority shareholders

Promoters

Pledged Promoter Holdings

80.264

Mutual Funds

Held by 0 Schemes

FIIs

Held by 14 FIIs (0.28%)

Promoter with highest holding

Shirdi Sai Electricals Limited (72.18%)

Highest Public shareholder

None

Individual Investors Holdings

19.29%

stock-summaryFinancial
[
  {
    "link": "quarterly",
    "btn_text": "All Quarterly Results",
    "header": "Quarterly Results Snapshot (Standalone) - Jun'26 - QoQ",
    "rhs": [
      {
        "prefix": "Net Sales ",
        "suffix": "QoQ Growth in quarter ended Jun 2026 is -4.64% vs 21.75% in Mar 2026",
        "dir": -1
      },
      {
        "prefix": "Standalone Net Profit ",
        "suffix": "QoQ Growth in quarter ended Jun 2026 is 7.44% vs -3.94% in Mar 2026",
        "dir": 1
      }
    ],
    "table": {
      "header": [
        "Jun'26",
        "Mar'26",
        "Change(%)"
      ],
      "body": [
        {
          "field": "Net Sales",
          "val1": "227.89",
          "val2": "238.99",
          "chgp": "-4.64%",
          "chgp_class": "negative"
        },
        {
          "field": "Operating Profit (PBDIT) excl Other Income",
          "val1": "31.79",
          "val2": "32.36",
          "chgp": "-1.76%",
          "chgp_class": "negative"
        },
        {
          "field": "Interest",
          "val1": "0.50",
          "val2": "0.51",
          "chgp": "-1.96%",
          "chgp_class": "positive"
        },
        {
          "field": "Exceptional Items",
          "val1": "0.00",
          "val2": "0.00",
          "chgp": "",
          "chgp_class": "neutral"
        },
        {
          "field": "Standalone Net Profit",
          "val1": "25.70",
          "val2": "23.92",
          "chgp": "7.44%",
          "chgp_class": "positive"
        },
        {
          "field": "Operating Profit Margin (Excl OI)",
          "val1": "13.95%",
          "val2": "13.54%",
          "chgp": "0.41%",
          "chgp_class": "positive"
        }
      ]
    }
  },
  {
    "link": "half-yearly",
    "btn_text": "All Half Yearly Results",
    "header": "Half Yearly Results Snapshot (Standalone) - Sep'25",
    "rhs": [
      {
        "prefix": "Net Sales ",
        "suffix": " Growth in half year ended Sep 2025 is 51.85% vs 20.82% in Sep 2024",
        "dir": 1
      },
      {
        "prefix": "Standalone Net Profit ",
        "suffix": " Growth in half year ended Sep 2025 is 85.99% vs 122.71% in Sep 2024",
        "dir": -1
      }
    ],
    "table": {
      "header": [
        "Sep'25",
        "Sep'24",
        "Change(%)"
      ],
      "body": [
        {
          "field": "Net Sales",
          "val1": "346.79",
          "val2": "228.38",
          "chgp": "51.85%",
          "chgp_class": "positive"
        },
        {
          "field": "Operating Profit (PBDIT) excl Other Income",
          "val1": "54.95",
          "val2": "31.21",
          "chgp": "76.07%",
          "chgp_class": "positive"
        },
        {
          "field": "Interest",
          "val1": "1.13",
          "val2": "0.94",
          "chgp": "20.21%",
          "chgp_class": "negative"
        },
        {
          "field": "Exceptional Items",
          "val1": "0.00",
          "val2": "0.00",
          "chgp": "",
          "chgp_class": "neutral"
        },
        {
          "field": "Standalone Net Profit",
          "val1": "43.95",
          "val2": "23.63",
          "chgp": "85.99%",
          "chgp_class": "positive"
        },
        {
          "field": "Operating Profit Margin (Excl OI)",
          "val1": "15.85%",
          "val2": "13.67%",
          "chgp": "2.18%",
          "chgp_class": "positive"
        }
      ]
    }
  },
  {
    "link": "nine-monthly",
    "btn_text": "All Nine Monthly Results",
    "header": "Nine Monthly Results Snapshot (Standalone) - Dec'25",
    "rhs": [
      {
        "prefix": "Net Sales ",
        "suffix": "YoY Growth in nine months ended Dec 2025 is 33.86% vs 23.51% in Dec 2024",
        "dir": 1
      },
      {
        "prefix": "Standalone Net Profit ",
        "suffix": "YoY Growth in nine months ended Dec 2025 is 60.49% vs 101.50% in Dec 2024",
        "dir": -1
      }
    ],
    "table": {
      "header": [
        "Dec'25",
        "Dec'24",
        "Change(%)"
      ],
      "body": [
        {
          "field": "Net Sales",
          "val1": "543.09",
          "val2": "405.72",
          "chgp": "33.86%",
          "chgp_class": "positive"
        },
        {
          "field": "Operating Profit (PBDIT) excl Other Income",
          "val1": "87.94",
          "val2": "55.46",
          "chgp": "58.56%",
          "chgp_class": "positive"
        },
        {
          "field": "Interest",
          "val1": "1.71",
          "val2": "1.54",
          "chgp": "11.04%",
          "chgp_class": "negative"
        },
        {
          "field": "Exceptional Items",
          "val1": "0.00",
          "val2": "0.00",
          "chgp": "",
          "chgp_class": "neutral"
        },
        {
          "field": "Standalone Net Profit",
          "val1": "68.85",
          "val2": "42.90",
          "chgp": "60.49%",
          "chgp_class": "positive"
        },
        {
          "field": "Operating Profit Margin (Excl OI)",
          "val1": "16.19%",
          "val2": "13.67%",
          "chgp": "2.52%",
          "chgp_class": "positive"
        }
      ]
    }
  },
  {
    "link": "annual",
    "btn_text": "All Annual Results",
    "header": "Annual Results Snapshot (Standalone) - Mar'26",
    "rhs": [
      {
        "prefix": "Net Sales ",
        "suffix": "YoY Growth in year ended Mar 2026 is 27.84% vs 21.58% in Mar 2025",
        "dir": 1
      },
      {
        "prefix": "Standalone Net Profit ",
        "suffix": "YoY Growth in year ended Mar 2026 is 45.23% vs 36.32% in Mar 2025",
        "dir": 1
      }
    ],
    "table": {
      "header": [
        "Mar'26",
        "Mar'25",
        "Change(%)"
      ],
      "body": [
        {
          "field": "Net Sales",
          "val1": "782.08",
          "val2": "611.78",
          "chgp": "27.84%",
          "chgp_class": "positive"
        },
        {
          "field": "Operating Profit (PBDIT) excl Other Income",
          "val1": "120.30",
          "val2": "76.13",
          "chgp": "58.02%",
          "chgp_class": "positive"
        },
        {
          "field": "Interest",
          "val1": "2.22",
          "val2": "2.12",
          "chgp": "4.72%",
          "chgp_class": "negative"
        },
        {
          "field": "Exceptional Items",
          "val1": "0.00",
          "val2": "0.00",
          "chgp": "",
          "chgp_class": "neutral"
        },
        {
          "field": "Standalone Net Profit",
          "val1": "92.77",
          "val2": "63.88",
          "chgp": "45.23%",
          "chgp_class": "positive"
        },
        {
          "field": "Operating Profit Margin (Excl OI)",
          "val1": "15.38%",
          "val2": "12.44%",
          "chgp": "2.94%",
          "chgp_class": "positive"
        }
      ]
    }
  }
]

Quarterly Results Snapshot (Standalone) - Jun'26 - QoQstock-summary

Jun'26
Mar'26
Change(%)
Net Sales
227.89
238.99
-4.64%
Operating Profit (PBDIT) excl Other Income
31.79
32.36
-1.76%
Interest
0.50
0.51
-1.96%
Exceptional Items
0.00
0.00
Standalone Net Profit
25.70
23.92
7.44%
Operating Profit Margin (Excl OI)
13.95%
13.54%
0.41%
Values in Rs Cr.
Direction Arrows
Net Sales

QoQ Growth in quarter ended Jun 2026 is -4.64% vs 21.75% in Mar 2026

Direction Arrows
Standalone Net Profit

QoQ Growth in quarter ended Jun 2026 is 7.44% vs -3.94% in Mar 2026

Half Yearly Results Snapshot (Standalone) - Sep'25stock-summary

Sep'25
Sep'24
Change(%)
Net Sales
346.79
228.38
51.85%
Operating Profit (PBDIT) excl Other Income
54.95
31.21
76.07%
Interest
1.13
0.94
20.21%
Exceptional Items
0.00
0.00
Standalone Net Profit
43.95
23.63
85.99%
Operating Profit Margin (Excl OI)
15.85%
13.67%
2.18%
Values in Rs Cr.
Direction Arrows
Net Sales

Growth in half year ended Sep 2025 is 51.85% vs 20.82% in Sep 2024

Direction Arrows
Standalone Net Profit

Growth in half year ended Sep 2025 is 85.99% vs 122.71% in Sep 2024

Nine Monthly Results Snapshot (Standalone) - Dec'25stock-summary

Dec'25
Dec'24
Change(%)
Net Sales
543.09
405.72
33.86%
Operating Profit (PBDIT) excl Other Income
87.94
55.46
58.56%
Interest
1.71
1.54
11.04%
Exceptional Items
0.00
0.00
Standalone Net Profit
68.85
42.90
60.49%
Operating Profit Margin (Excl OI)
16.19%
13.67%
2.52%
Values in Rs Cr.
Direction Arrows
Net Sales

YoY Growth in nine months ended Dec 2025 is 33.86% vs 23.51% in Dec 2024

Direction Arrows
Standalone Net Profit

YoY Growth in nine months ended Dec 2025 is 60.49% vs 101.50% in Dec 2024

Annual Results Snapshot (Standalone) - Mar'26stock-summary

Mar'26
Mar'25
Change(%)
Net Sales
782.08
611.78
27.84%
Operating Profit (PBDIT) excl Other Income
120.30
76.13
58.02%
Interest
2.22
2.12
4.72%
Exceptional Items
0.00
0.00
Standalone Net Profit
92.77
63.88
45.23%
Operating Profit Margin (Excl OI)
15.38%
12.44%
2.94%
Values in Rs Cr.
Direction Arrows
Net Sales

YoY Growth in year ended Mar 2026 is 27.84% vs 21.58% in Mar 2025

Direction Arrows
Standalone Net Profit

YoY Growth in year ended Mar 2026 is 45.23% vs 36.32% in Mar 2025

stock-summaryCompany CV
About Indo Tech Transformers Ltd stock-summary
stock-summary
Indo Tech Transformers Ltd
Small Cap
Heavy Electrical Equipment
Indo Tech Transformers Limited, the flagship of the Indo Tech Group is engaged in the business of manufacturing power and distribution transformers and various special application transformers, mobile sub-station transformers and sub-stations. The Company has manufacturing plant located at Palakkad in Kerala and Kancheepuram in Tamil Nadu. The company manufactures Open Ventilated Dry Type Transformers in technical tie-up with E I Dupont.
Company Coordinates stock-summary
Company Details
SNo 153-210 Illuppapattu Villa, Near Rajakulam Kancheepuram Tamil Nadu : 631561
stock-summary
Tel:
stock-summary
investor@prolec-geindia.com
Registrar Details
Link Intime India Pvt Ltd, C-13 Pannalal Silk Compound, L B S Marg, Bhandup , Mumbai