
 Price Point
Compare Indokem with Similar Stocks
ScoreDashboard
Weak Long Term Fundamental Strength with an average Return on Capital Employed (ROCE) of 3.17%
- Poor long term growth as Net Sales has grown by an annual rate of 7.36% and Operating profit at 9.34% over the last 5 years
- Company's ability to service its debt is weak with a poor EBIT to Interest (avg) ratio of 0.67
Flat results in Jun 26
With ROCE of 2.8, it has a Very Expensive valuation with a 20.1 Enterprise value to Capital Employed
Despite the size of the company, domestic mutual funds hold only 0.31% of the company
Mojo ParametersStock DNA

Specialty Chemicals

INR 1,729 Cr (Micro Cap)

772.00
19

0.00%

0.35

2.90%

26.81
Total ReturnsTotal Returns (Price + Dividend) 
Indokem for the last several years.
Risk Adjusted Returns v/s
Returns Beta
 News & Corporate Actions
News
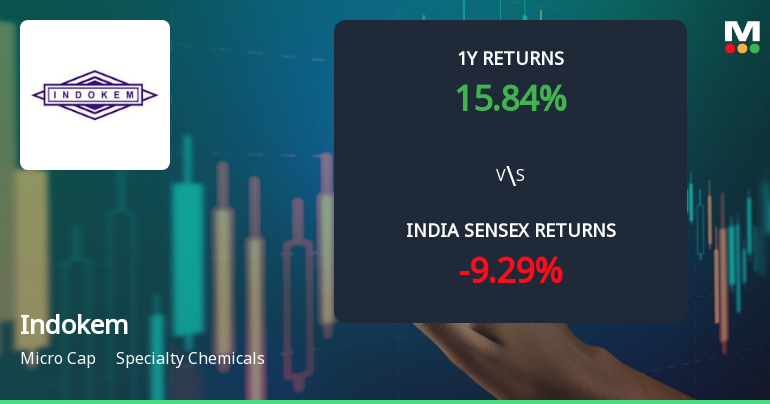
Indokem Ltd Technical Momentum Shifts Amid Mixed Indicator Signals
Indokem Ltd, a micro-cap player in the specialty chemicals sector, has exhibited a subtle shift in its technical momentum, moving from a sideways trend to a mildly bullish stance. Despite a strong sell Mojo Grade of 27.0, recently downgraded from Sell on 21 Sep 2026, the stock’s technical indicators present a nuanced picture that warrants close examination for investors seeking to understand its near-term trajectory.
Read full news article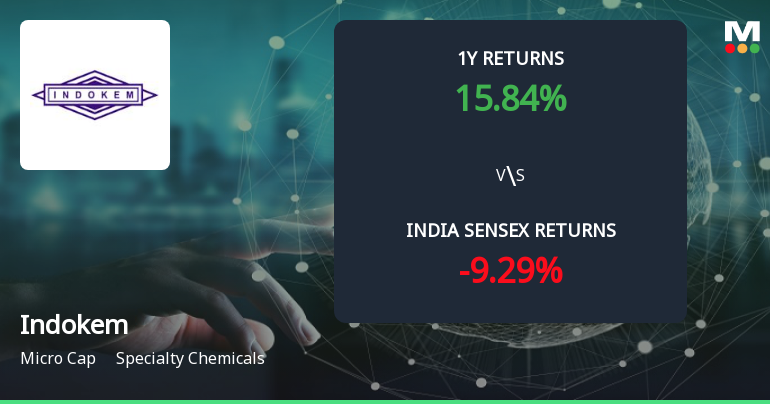
Golden Cross Forms in Indokem Ltd — On a Day the Stock Barely Moved. What the Mixed Signals Mean
The 50-day moving average has crossed above the 200-day moving average for Indokem Ltd, signalling a golden cross on 22 Sep 2026. Yet, the stock’s price was virtually unchanged on the day, and the monthly technical indicators remain mildly bearish. This juxtaposition of signals calls for a detailed examination of whether the golden cross is a reliable indicator or a lone beacon amid mixed data.
Read full news article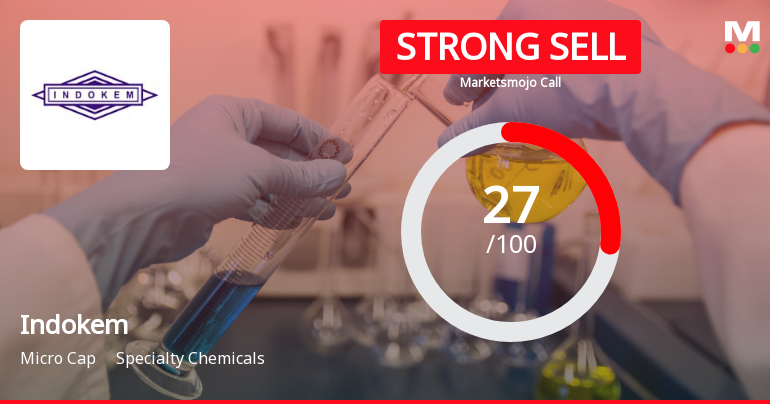
Indokem Ltd Downgraded to Strong Sell Amid Technical and Fundamental Concerns
Indokem Ltd, a micro-cap player in the specialty chemicals sector, has seen its investment rating downgraded from Sell to Strong Sell as of 21 Sep 2026. This shift reflects deteriorating technical indicators, weak financial trends, expensive valuation metrics, and poor quality fundamentals, signalling caution for investors despite the stock’s recent market-beating returns.
Read full news article Announcements
Closure of Trading Window
21-Sep-2026 | Source : BSEIntimation of Closure of Trading Window from Thursday 1st October 2026 till 48 hours after the declaration of the Unaudited Financial Results of the Company for the quarter and half year ended 30th September 2026.
Announcement under Regulation 30 (LODR)-Newspaper Publication
02-Sep-2026 | Source : BSEPursuant to Regulation 30 of the SEBI (LODR) Regulations 2015 and SEBI circular dated 30th january 2026 we hereby enclose copies of the newspaper advertisements published on 02nd September 2026 in connection with the request received from shareholder for re-lodgement of transfer deeds of physical shares as per the aforesaid circular.
Announcement under Regulation 30 (LODR)-Newspaper Publication
29-Aug-2026 | Source : BSEPursuant to Regulation 47 of SEBI (LODR) Regulations 2015 we enclose herewith copy of the newspaper advertisements published on 29th August 2026 regarding notice of the 60th AGM of the company remote e-voting information book closure and opening of special window for re-lodgement of the transfer requests of physical shares of investors. For details kindly refer the enclosed intimation.
Corporate Actions

No Upcoming Board Meetings

No Dividend history available

No Splits history available

No Bonus history available

No Rights history available
Key FactorsQuality key factors
Valuation key factors
Technicals key factors
 Technical Indicator Scale: Bearish, Mildly Bearish, Sideways, Mildly Bullish, Bullish Turned Shareholding
Shareholding Snapshot : Jun 2026
Shareholding Compare (%holding)
Promoters
None
Held by 10 Schemes (0.1%)
Held by 0 FIIs
Vindhyapriya Holdings Pvt Ltd (19.76%)
Sangeetha S (1.79%)
25.52%
FinancialQuarterly Results Snapshot (Consolidated) - Jun'26 - YoY
 Compare with Peers
YoY Growth in quarter ended Jun 2026 is 12.17% vs 12.41% in Jun 2025
YoY Growth in quarter ended Jun 2026 is 52.86% vs 150.72% in Jun 2025

Half Yearly Results Snapshot (Consolidated) - Sep'25

Growth in half year ended Sep 2025 is 1.99% vs -5.01% in Sep 2024
Growth in half year ended Sep 2025 is 180.43% vs 72.67% in Sep 2024
Nine Monthly Results Snapshot (Consolidated) - Dec'25
YoY Growth in nine months ended Dec 2025 is 0.18% vs -0.87% in Dec 2024
YoY Growth in nine months ended Dec 2025 is 337.50% vs 87.67% in Dec 2024
Annual Results Snapshot (Consolidated) - Mar'26
YoY Growth in year ended Mar 2026 is -4.89% vs 8.06% in Mar 2025
YoY Growth in year ended Mar 2026 is -41.01% vs 151.21% in Mar 2025
 Company CV
About Indokem Ltd










