
Compare Indrapr.Medical with Similar Stocks
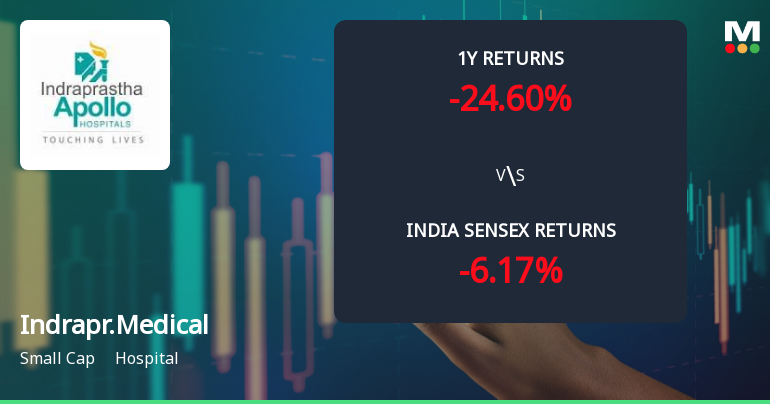
Total Returns (Price + Dividend) 
Latest dividend: 4.5 per share ex-dividend date: Sep-18-2025
Risk Adjusted Returns v/s
Returns Beta

News
Indraprastha Medical Corporation Ltd Faces Bearish Momentum Amid Technical Downgrade
Indraprastha Medical Corporation Ltd, a small-cap player in the hospital sector, has experienced a notable shift in its technical momentum, moving from a mildly bearish stance to a more pronounced bearish trend. This transition is underscored by a combination of weakening moving averages, bearish Bollinger Bands, and mixed signals from key momentum indicators such as MACD and RSI, signalling caution for investors amid recent price declines.
Read full news article
Indraprastha Medical Corporation Ltd is Rated Sell
Indraprastha Medical Corporation Ltd is rated 'Sell' by MarketsMOJO, with this rating last updated on 30 January 2026. However, the analysis and financial metrics discussed here reflect the stock's current position as of 06 July 2026, providing investors with an up-to-date view of the company’s fundamentals, returns, and market performance.
Read full news article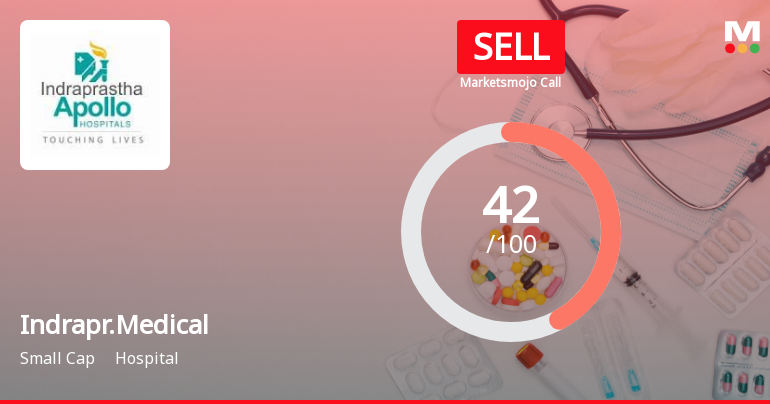
Indraprastha Medical Corporation Ltd is Rated Sell
Indraprastha Medical Corporation Ltd is rated Sell by MarketsMOJO. This rating was last updated on 30 January 2026. However, all fundamentals, returns, and financial metrics discussed here reflect the stock’s current position as of 25 June 2026, providing investors with the latest comprehensive analysis.
Read full news article Announcements
Indraprastha Medical Corporation Limited - Other General Purpose
09-Dec-2019 | Source : NSEIndraprastha Medical Corporation Limited has informed the Exchange regarding issue of duplicate share certificates.
Indraprastha Medical Corporation Limited - Outcome of Board Meeting
05-Nov-2019 | Source : NSEIndraprastha Medical Corporation Limited has informed the Exchange regarding Board meeting held on November 05, 2019.
Indraprastha Medical Corporation Limited - Trading Window
26-Sep-2019 | Source : NSEIndraprastha Medical Corporation Limited has informed the Exchange regarding the Trading Window closure pursuant to SEBI (Prohibition of Insider Trading) Regulations, 2015
Corporate Actions

No Upcoming Board Meetings

Indraprastha Medical Corporation Ltd has declared 45% dividend, ex-date: 18 Sep 25

No Splits history available

No Bonus history available

No Rights history available
Quality key factors
Valuation key factors
Technicals key factors
 Technical Indicator Scale: Bearish, Mildly Bearish, Sideways, Mildly Bullish, Bullish Turned
 Shareholding Snapshot : Mar 2026
Shareholding Compare (%holding)
Promoters
None
Held by 3 Schemes (0.01%)
Held by 59 FIIs (2.44%)
President Of India (26.0%)
Vanjana Sundar Iyer (2.01%)
31.83%
Quarterly Results Snapshot (Standalone) - Mar'26 - YoY

YoY Growth in quarter ended Mar 2026 is 9.31% vs 6.04% in Mar 2025

YoY Growth in quarter ended Mar 2026 is 1.68% vs 31.57% in Mar 2025
Half Yearly Results Snapshot (Standalone) - Sep'25
Growth in half year ended Sep 2025 is 6.94% vs 11.90% in Sep 2024
Growth in half year ended Sep 2025 is 15.77% vs 37.60% in Sep 2024
Nine Monthly Results Snapshot (Standalone) - Dec'25
YoY Growth in nine months ended Dec 2025 is 9.30% vs 9.96% in Dec 2024
YoY Growth in nine months ended Dec 2025 is 18.29% vs 29.30% in Dec 2024
Annual Results Snapshot (Standalone) - Mar'26
YoY Growth in year ended Mar 2026 is 9.30% vs 8.97% in Mar 2025
YoY Growth in year ended Mar 2026 is 14.06% vs 29.87% in Mar 2025
About Indraprastha Medical Corporation Ltd

Company Coordinates


