
Compare Indsil Hydro with Similar Stocks
Dashboard
Low ability to service debt as the company has a high Debt to EBITDA ratio of -63.16 times
- Low ability to service debt as the company has a high Debt to EBITDA ratio of -63.16 times
- The company has been able to generate a Return on Capital Employed (avg) of 3.84% signifying low profitability per unit of total capital (equity and debt)
Poor long term growth as Operating profit has grown by an annual rate 17.87% of over the last 5 years
Consistent Underperformance against the benchmark over the last 3 years
Total Returns (Price + Dividend) 
Latest dividend: 0.5 per share ex-dividend date: Sep-04-2025
Risk Adjusted Returns v/s
Returns Beta

News
Indsil Hydro Power & Manganese Ltd is Rated Sell
Indsil Hydro Power & Manganese Ltd is rated 'Sell' by MarketsMOJO, with this rating last updated on 26 May 2026. However, the analysis and financial metrics discussed here reflect the company’s current position as of 08 July 2026, providing investors with an up-to-date view of its performance and outlook.
Read full news article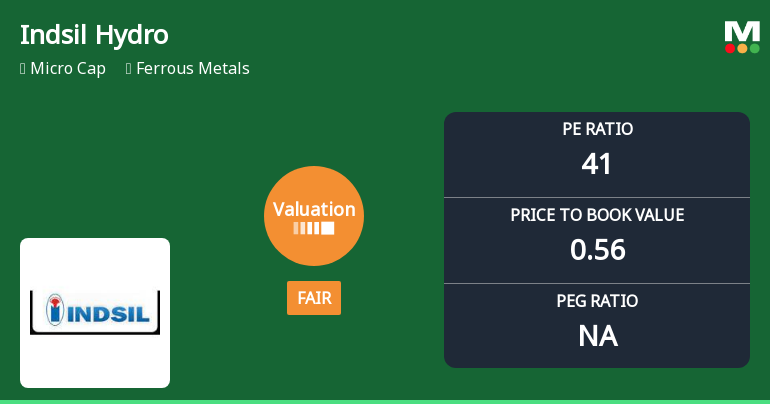
Indsil Hydro Power & Manganese Ltd Valuation Shifts Signal Improved Price Attractiveness
Indsil Hydro Power & Manganese Ltd, a micro-cap player in the ferrous metals sector, has witnessed a notable shift in its valuation parameters, moving from an expensive to a fair valuation grade. Despite a recent downgrade in its overall Mojo Grade from Strong Sell to Sell, the company’s price-to-earnings (P/E) and price-to-book value (P/BV) ratios suggest a changing landscape in price attractiveness relative to its historical averages and peer group.
Read full news article
Indsil Hydro Power & Manganese Ltd is Rated Sell
Indsil Hydro Power & Manganese Ltd is rated 'Sell' by MarketsMOJO, with this rating last updated on 26 May 2026. However, the analysis and financial metrics discussed here reflect the stock's current position as of 27 June 2026, providing investors with an up-to-date perspective on the company’s performance and outlook.
Read full news article Announcements
Compliances-Certificate under Reg. 74 (5) of SEBI (DP) Regulations 2018
03-Jul-2026 | Source : BSEWe enclose herewith the Certificate under Regulation 74(5) of the SEBI (Depositories and Participants) Regulations 2018 for the quarter ended June 30 2026
Closure of Trading Window
24-Jun-2026 | Source : BSENotice is hereby given that pursuant to SEBI (Prohibition of Insider Trading) Regulations 2015 read with Companys Code of Conduct to regulate monitor and report trading by Designated Persons the Trading window for trading in the equity shares of the Company will be closed from 1st July 2026 till 48 hours from the date of declaration of the Unaudited financial results for the quarter ending 30th June 2026 (both days inclusive). The date of meeting of the Board to approve the unaudited financial results will be informed in the due course.
Announcement under Regulation 30 (LODR)-Newspaper Publication
11-Jun-2026 | Source : BSEWe enclose herewith the copies of newspaper published today
Corporate Actions

No Upcoming Board Meetings

Indsil Hydro Power & Manganese Ltd has declared 5% dividend, ex-date: 04 Sep 25

No Splits history available

Indsil Hydro Power & Manganese Ltd has announced 2:3 bonus issue, ex-date: 15 Oct 10

No Rights history available
Quality key factors
Valuation key factors
Technicals key factors
 Technical Indicator Scale: Bearish, Mildly Bearish, Sideways, Mildly Bullish, Bullish Turned
 Shareholding Snapshot : Mar 2026
Shareholding Compare (%holding)
Promoters
None
Held by 0 Schemes
Held by 0 FIIs
Sunmet Holdings India Private Limited (49.95%)
Kerala State Industrial Development Corporation (3.79%)
28.1%
Quarterly Results Snapshot (Standalone) - Mar'26 - YoY

YoY Growth in quarter ended Mar 2026 is 17.73% vs 6.61% in Mar 2025
YoY Growth in quarter ended Mar 2026 is 104.32% vs -28,155.56% in Mar 2025
Half Yearly Results Snapshot (Standalone) - Sep'25
Growth in half year ended Sep 2025 is 26.52% vs -7.69% in Sep 2024

Growth in half year ended Sep 2025 is -89.83% vs 1,106.33% in Sep 2024
Nine Monthly Results Snapshot (Standalone) - Dec'25
YoY Growth in nine months ended Dec 2025 is 19.14% vs 10.35% in Dec 2024
YoY Growth in nine months ended Dec 2025 is -86.27% vs 1,219.67% in Dec 2024
Annual Results Snapshot (Consolidated) - Mar'26
YoY Growth in year ended Mar 2026 is 29.94% vs -34.05% in Mar 2024
YoY Growth in year ended Mar 2026 is 250.60% vs -10.18% in Mar 2024
About Indsil Hydro Power & Manganese Ltd

Company Coordinates


