
Compare Infosys with Similar Stocks
Dashboard
Strong Long Term Fundamental Strength with an average Return on Equity (ROE) of 31.68%
- Healthy long term growth as Net Sales has grown by an annual rate of 12.01%
- The company is Net-Debt Free
Positive results in Jun 26
With ROE of 34.3, it has a Attractive valuation with a 5.1 Price to Book Value
Reducing Promoter Confidence
Below par performance in long term as well as near term
Stock DNA
Computers - Software & Consulting
INR 457,370 Cr (Large Cap)
15.00
21
4.20%
-0.23
34.27%
5.15
Total Returns (Price + Dividend) 
Latest dividend: 25 per share ex-dividend date: Jun-10-2026
Risk Adjusted Returns v/s
Returns Beta

News
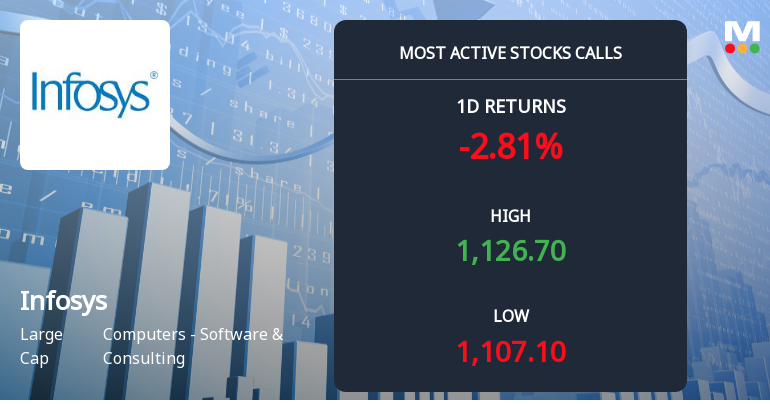
5,412 Call Contracts Traded on Infosys Ltd as Stock Dips 2.7% Amid Mixed Signals
On 31 Jul 2026, 5,412 call contracts at the Rs 1,200 strike were exchanged on Infosys Ltd, while the stock closed lower by 2.7% at Rs 1,122.9. This juxtaposition of heavy call activity against a declining cash price highlights a nuanced positioning in the options market that merits closer examination.
Read full news article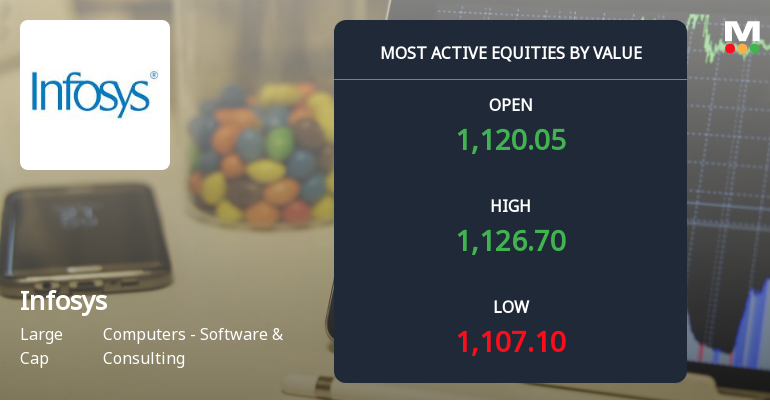
Infosys Ltd Sees High-Value Trading Amid Mixed Market Signals
Infosys Ltd (INFY), a stalwart in the Computers - Software & Consulting sector, witnessed significant trading activity on 31 Jul 2026, with a total traded value exceeding ₹29,516 lakhs. Despite this high-value turnover, the stock underperformed its sector and recorded a notable decline, reflecting mixed investor sentiment amid broader IT sector weakness.
Read full news article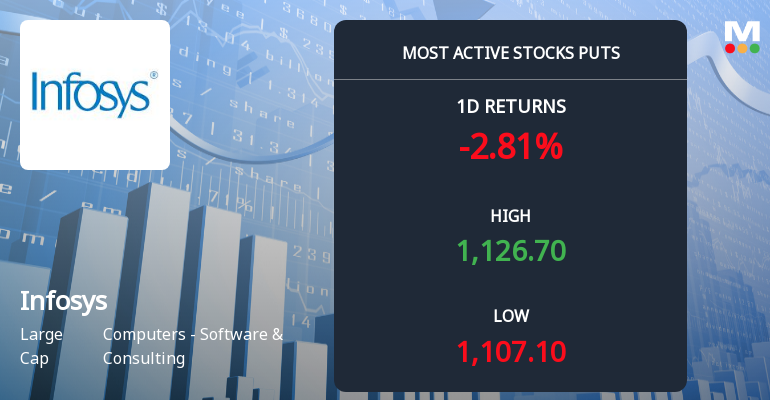
Rs 1,080 Puts — 4.1% Below Current Price — Draw 2,602 Contracts on Infosys Ltd
The stock is down 2.7% today, yet 2,602 put contracts at the Rs 1,080 strike traded heavily on 31 Jul 2026. This strike sits roughly 4.1% below the current price of Rs 1,124.6, suggesting the put activity may be more about hedging than outright bearish conviction.
Read full news article Announcements
Infosys Limited - Analysts/Institutional Investor Meet/Con. Call Updates
05-Dec-2019 | Source : NSEInfosys Limited has informed the Exchange regarding Analysts/Institutional Investor Meet/Con. Call Updates
Infosys Limited - Analysts/Institutional Investor Meet/Con. Call Updates
03-Dec-2019 | Source : NSEInfosys Limited has informed the Exchange regarding Analysts/Institutional Investor Meet/Con. Call Updates
Infosys Limited - Press Release
26-Nov-2019 | Source : NSEInfosys Limited has informed the Exchange regarding a press release dated November 26, 2019, titled "Infosys Launches Cyber Next Platform-Based Offerings, Powered by Microsoft Azure Sentinel".
Corporate Actions

No Upcoming Board Meetings

Infosys Ltd has declared 500% dividend, ex-date: 10 Jun 26

No Splits history available

Infosys Ltd has announced 1:1 bonus issue, ex-date: 04 Sep 18

No Rights history available
Quality key factors
Valuation key factors
Technicals key factors
 Technical Indicator Scale: Bearish, Mildly Bearish, Sideways, Mildly Bullish, Bullish Turned
 Shareholding Snapshot : Jun 2026
Shareholding Compare (%holding)
FIIs
None
Held by 45 Schemes (23.0%)
Held by 1378 FIIs (27.09%)
Sudha Gopalakrishnan (2.55%)
Life Insurance Corporation Of India - Ulif00220091 (11.73%)
13.0%
Quarterly Results Snapshot (Consolidated) - Jun'26 - QoQ

QoQ Growth in quarter ended Jun 2026 is 3.90% vs 2.03% in Mar 2026

QoQ Growth in quarter ended Jun 2026 is -8.61% vs 27.76% in Mar 2026
Half Yearly Results Snapshot (Consolidated) - Sep'25
Growth in half year ended Sep 2025 is 8.06% vs 4.38% in Sep 2024
Growth in half year ended Sep 2025 is 10.96% vs 5.90% in Sep 2024
Nine Monthly Results Snapshot (Consolidated) - Dec'25
YoY Growth in nine months ended Dec 2025 is 8.34% vs 5.46% in Dec 2024
YoY Growth in nine months ended Dec 2025 is 6.40% vs 7.76% in Dec 2024
Annual Results Snapshot (Consolidated) - Mar'26
YoY Growth in year ended Mar 2026 is 9.61% vs 6.06% in Mar 2025
YoY Growth in year ended Mar 2026 is 10.21% vs 1.83% in Mar 2025
About Infosys Ltd

Company Coordinates


