
Compare Infosys with Similar Stocks
Dashboard
Strong Long Term Fundamental Strength with an average Return on Equity (ROE) of 30.33%
- Healthy long term growth as Net Sales has grown by an annual rate of 12.20%
- The company is Net-Debt Free
Positive results in Mar 26
With ROE of 32.7, it has a Attractive valuation with a 4.6 Price to Book Value
High Institutional Holdings at 71.85%
Below par performance in long term as well as near term
Stock DNA
Computers - Software & Consulting
INR 422,455 Cr (Large Cap)
14.00
20
4.72%
-0.28
32.71%
4.50
Total Returns (Price + Dividend) 
Latest dividend: 25 per share ex-dividend date: Jun-10-2026
Risk Adjusted Returns v/s
Returns Beta

News
Infosys Ltd Rallies 3.12% Amidst Broader Market Strength — Testing Key Resistance Levels
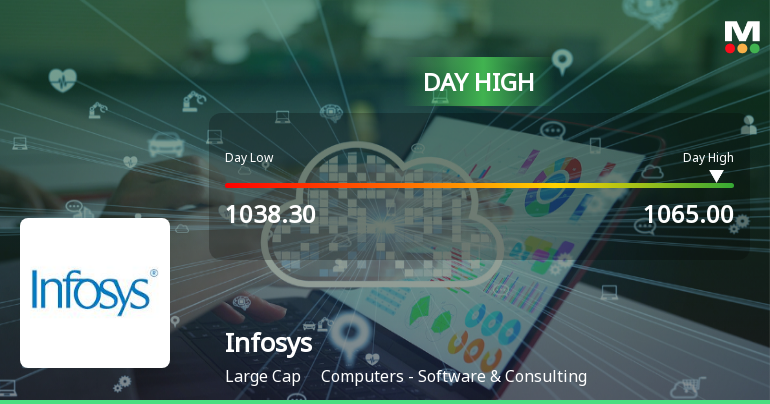
The Sensex climbed 1.17% on 24 Jun 2026, yet Infosys Ltd outpaced the benchmark with a 3.12% gain, touching an intraday high of Rs 1057. This 1.95-percentage-point outperformance signals a stock-specific momentum shift rather than a mere market tailwind.
Read full news article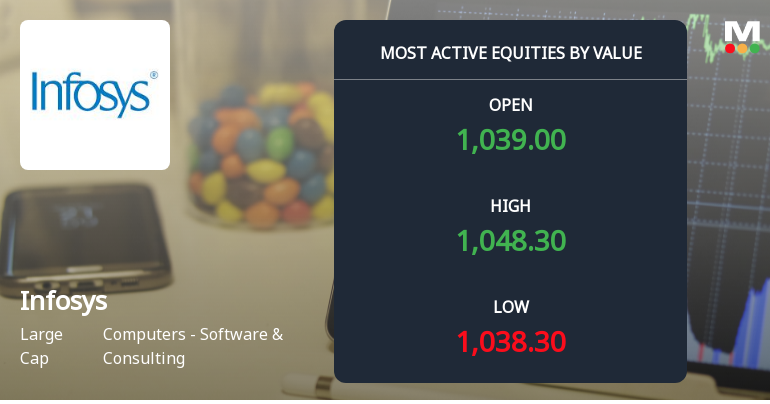
Infosys Ltd Sees Elevated Trading Value Amid Narrow Price Range and Institutional Interest
Infosys Ltd (INFY), a stalwart in the Computers - Software & Consulting sector, recorded significant value turnover on 24 June 2026, reflecting heightened investor participation and institutional interest. Despite trading close to its 52-week low, the stock outperformed its sector and the broader Sensex, signalling nuanced market dynamics for this large-cap software giant.
Read full news article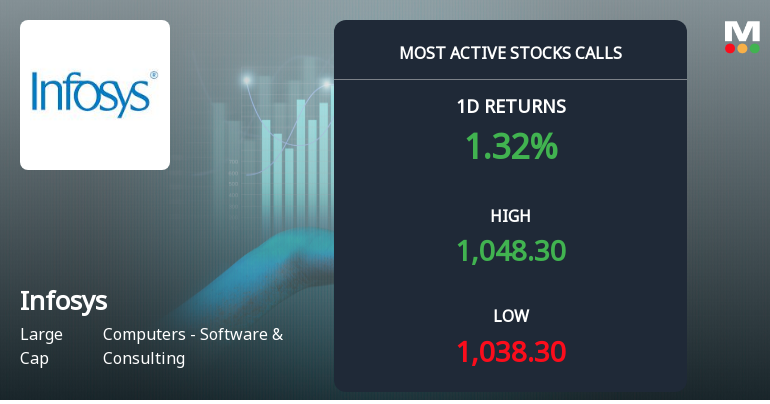
9,375 Call Contracts at Rs 1,050 Strike on Infosys Ltd Signal Strong Directional Interest Ahead of June Expiry
On 24 Jun 2026, 9,375 call contracts at the Rs 1,050 strike price changed hands on Infosys Ltd, with the stock closing at Rs 1,047.50. This near-the-money activity, combined with a 1.25% gain in the cash market, highlights a clear directional positioning as the 30 June expiry approaches.
Read full news article Announcements
Announcement under Regulation 30 (LODR)-Allotment of ESOP / ESPS
22-Jun-2026 | Source : BSEAllotment of equity shares towards exercise of ESOPs
Announcement under Regulation 30 (LODR)-Newspaper Publication
18-Jun-2026 | Source : BSEEnclosed
Announcement under Regulation 30 (LODR)-Newspaper Publication
16-Jun-2026 | Source : BSEEnclosed
Corporate Actions

23 Jul 2026

Infosys Ltd has declared 500% dividend, ex-date: 10 Jun 26

No Splits history available

Infosys Ltd has announced 1:1 bonus issue, ex-date: 04 Sep 18

No Rights history available
Quality key factors
Valuation key factors
Technicals key factors
 Technical Indicator Scale: Bearish, Mildly Bearish, Sideways, Mildly Bullish, Bullish Turned
 Shareholding Snapshot : Mar 2026
Shareholding Compare (%holding)
FIIs
None
Held by 44 Schemes (23.5%)
Held by 1444 FIIs (28.45%)
Sudha Gopalakrishnan (2.54%)
Life Insurance Corporation Of India - Ulif00220091 (11.54%)
11.43%
Quarterly Results Snapshot (Consolidated) - Mar'26 - QoQ

QoQ Growth in quarter ended Mar 2026 is 2.03% vs 2.22% in Dec 2025

QoQ Growth in quarter ended Mar 2026 is 27.76% vs -9.64% in Dec 2025
Half Yearly Results Snapshot (Consolidated) - Sep'25
Growth in half year ended Sep 2025 is 8.06% vs 4.38% in Sep 2024
Growth in half year ended Sep 2025 is 10.96% vs 5.90% in Sep 2024
Nine Monthly Results Snapshot (Consolidated) - Dec'25
YoY Growth in nine months ended Dec 2025 is 8.34% vs 5.46% in Dec 2024
YoY Growth in nine months ended Dec 2025 is 6.40% vs 7.76% in Dec 2024
Annual Results Snapshot (Consolidated) - Mar'26
YoY Growth in year ended Mar 2026 is 9.61% vs 6.06% in Mar 2025
YoY Growth in year ended Mar 2026 is 10.21% vs 1.83% in Mar 2025
About Infosys Ltd

Company Coordinates


