
Compare Inox India with Similar Stocks
Stock DNA
Other Industrial Products
INR 16,344 Cr (Small Cap)
66.00
35
0.12%
-0.21
23.30%
13.63
Total Returns (Price + Dividend) 
Latest dividend: 2 per share ex-dividend date: Jun-09-2026
Risk Adjusted Returns v/s
Returns Beta

News
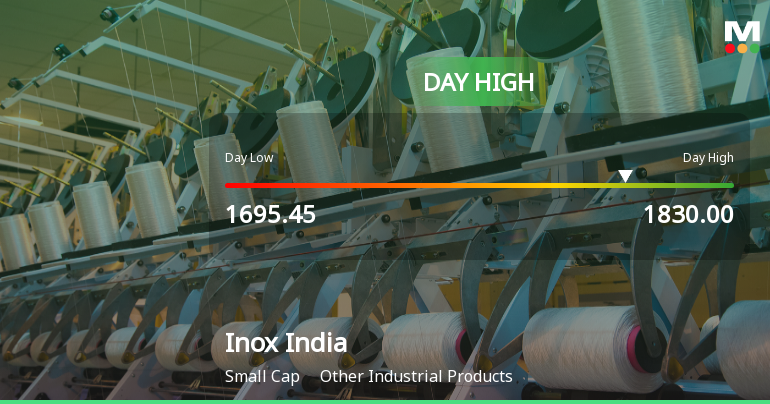
Inox India Ltd Surges 7.05% to Day's High of Rs 1830 — Outperforms Sector by 6.6 Percentage Points
The Sensex gained 0.65% on 10 Jun 2026, yet Inox India Ltd surged 7.05%, touching a fresh 52-week and all-time high of Rs 1830. This 6.6-percentage-point outperformance over its sector signals a distinctly stock-specific rally rather than a market-wide lift.
Read full news article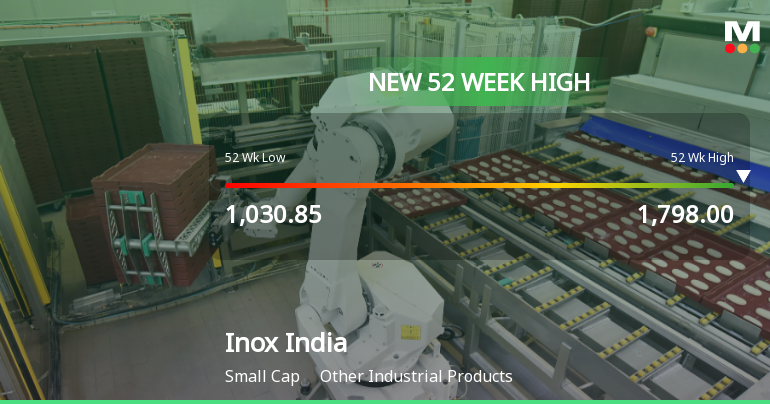
Broad-Based Technical Strength Lifts Inox India Ltd to 52-Week High of Rs 1829.8
Surging past its previous peaks, Inox India Ltd touched a new 52-week high of Rs 1829.8 on 10 Jun 2026, marking a remarkable 47.91% gain over the past year. This milestone reflects a sustained rally fuelled by strong technical momentum and consistent price appreciation, even as broader market indices remain subdued.
Read full news article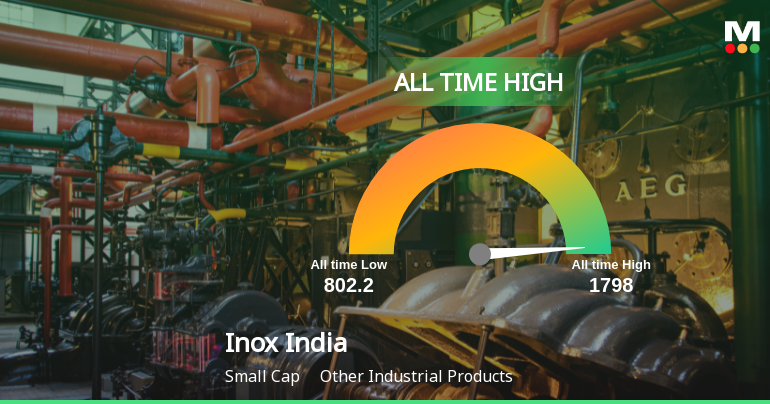
Strong Momentum Meets Stretched Valuations as Inox India Ltd Reaches All-Time High
Extending its winning streak to seven consecutive sessions, Inox India Ltd surged 8.19% on 10 Jun 2026 to touch a fresh all-time high of Rs 1,798. This rally has propelled the stock well above its key moving averages, underscoring robust short-term momentum that has outpaced both its sector and the broader market.
Read full news article Announcements
Announcement under Regulation 30 (LODR)-Analyst / Investor Meet - Intimation
02-Jun-2026 | Source : BSEIntimation of Investor / Analyst Meet
Announcement under Regulation 30 (LODR)-Newspaper Publication
02-Jun-2026 | Source : BSESubmission of Newspaper Publication regarding 49th AGM of the Company
Notice Of 49Th AGM Of The Company
01-Jun-2026 | Source : BSENotice of 49th AGM of the Company.
Corporate Actions

No Upcoming Board Meetings

Inox India Ltd has declared 100% dividend, ex-date: 09 Jun 26

No Splits history available

No Bonus history available

No Rights history available
Quality key factors
Valuation key factors
Technicals key factors
 Technical Indicator Scale: Bearish, Mildly Bearish, Sideways, Mildly Bullish, Bullish Turned
 Shareholding Snapshot : Mar 2026
Shareholding Compare (%holding)
Promoters
None
Held by 17 Schemes (6.01%)
Held by 83 FIIs (7.13%)
Siddharth Jain (34.13%)
Icici Prudential Elss Tax Saver Fund (2.36%)
8.01%
Quarterly Results Snapshot (Consolidated) - Mar'26 - QoQ

QoQ Growth in quarter ended Mar 2026 is 7.49% vs 19.64% in Dec 2025

QoQ Growth in quarter ended Mar 2026 is 23.95% vs -0.23% in Dec 2025
Half Yearly Results Snapshot (Consolidated) - Sep'25
Growth in half year ended Sep 2025 is 15.74% vs 6.51% in Sep 2024
Growth in half year ended Sep 2025 is 19.42% vs -1.17% in Sep 2024
Nine Monthly Results Snapshot (Consolidated) - Dec'25
YoY Growth in nine months ended Dec 2025 is 20.27% vs 9.31% in Dec 2024
YoY Growth in nine months ended Dec 2025 is 13.79% vs 5.65% in Dec 2024
Annual Results Snapshot (Consolidated) - Mar'26
YoY Growth in year ended Mar 2026 is 21.52% vs 15.23% in Mar 2025
YoY Growth in year ended Mar 2026 is 14.10% vs 15.32% in Mar 2025
About Inox India Ltd

Company Coordinates


