
Compare Insecticid.India with Similar Stocks
Stock DNA
Pesticides & Agrochemicals
INR 2,066 Cr (Small Cap)
15.00
28
0.28%
0.18
12.34%
1.70
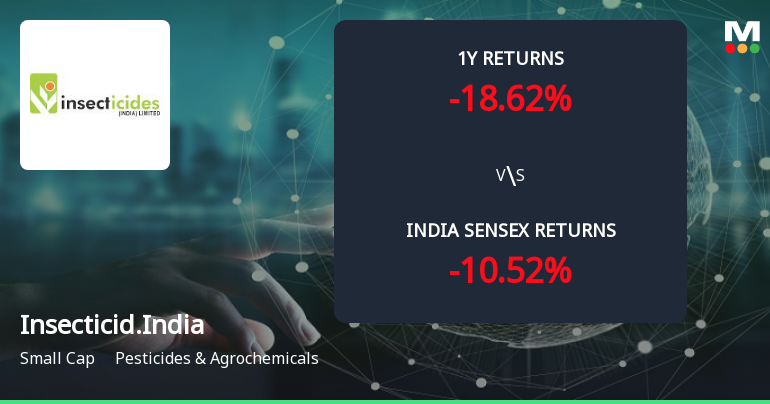
Total Returns (Price + Dividend) 
Latest dividend: 2 per share ex-dividend date: Feb-06-2026
Risk Adjusted Returns v/s
Returns Beta

News
Golden Cross Forms in Insecticides India Ltd — On a Day the Stock Fell 0.01%. What the Mixed Signals Mean
The 50-day moving average has crossed above the 200-day moving average for Insecticides India Ltd, signalling a golden cross on 11 Jun 2026. Yet, the stock’s price was essentially flat, down 0.01% on the day, while monthly technical indicators remain bearish. This juxtaposition of signals calls for a detailed examination of whether the golden cross stands as a reliable indicator or is contradicted by broader data.
Read full news article
Insecticides India Ltd is Rated Sell
Insecticides India Ltd is rated 'Sell' by MarketsMOJO, with this rating last updated on 25 May 2026. However, the analysis and financial metrics discussed here reflect the stock's current position as of 08 June 2026, providing investors with an up-to-date perspective on the company’s performance and outlook.
Read full news article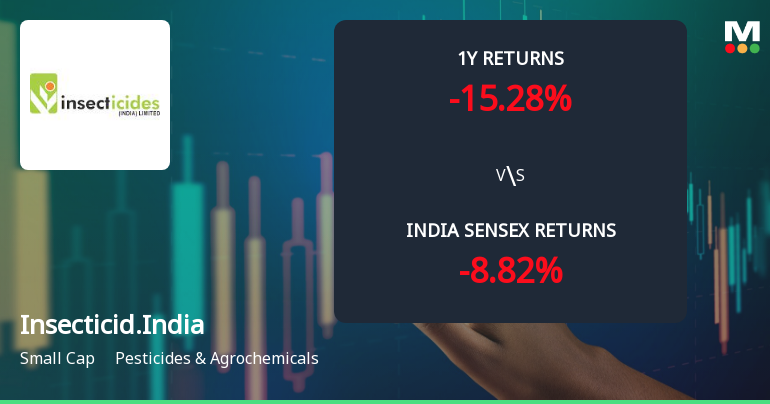
Insecticides India Ltd Technical Momentum Shifts Amid Mixed Indicator Signals
Insecticides India Ltd, a small-cap player in the Pesticides & Agrochemicals sector, has recently experienced a shift in its technical momentum, moving from a sideways trend to a mildly bearish stance. Despite some bullish weekly indicators, monthly signals and daily moving averages suggest caution for investors as the stock price retreated 1.71% to ₹720.25 on 2 June 2026.
Read full news article Announcements
Announcement under Regulation 30 (LODR)-Analyst / Investor Meet - Intimation
05-Jun-2026 | Source : BSEIntimation of Schedule of Analyst / Institutional Investor meetings under the SEBI (Listing Obligations and Disclosure Requirements) Regulations 2015
Announcement under Regulation 30 (LODR)-Earnings Call Transcript
03-Jun-2026 | Source : BSETranscript of the Earning Conference Call for the Quarter and Financial Year ended March 31 2026
Announcement under Regulation 30 (LODR)-Newspaper Publication
02-Jun-2026 | Source : BSENewspaper advertisement on Notice of transfer of equity shares of the Company to IEPF
Corporate Actions

No Upcoming Board Meetings

Insecticides India Ltd has declared 20% dividend, ex-date: 06 Feb 26

No Splits history available

Insecticides India Ltd has announced 1:2 bonus issue, ex-date: 30 Sep 22

No Rights history available
Quality key factors
Valuation key factors
Technicals key factors
 Technical Indicator Scale: Bearish, Mildly Bearish, Sideways, Mildly Bullish, Bullish Turned
 Shareholding Snapshot : Mar 2026
Shareholding Compare (%holding)
Promoters
None
Held by 2 Schemes (8.93%)
Held by 43 FIIs (4.5%)
Rajesh Kumar Aggarwal (16.63%)
Hdfc Small Cap Fund (9.06%)
11.03%
Quarterly Results Snapshot (Consolidated) - Mar'26 - YoY

YoY Growth in quarter ended Mar 2026 is 18.76% vs 31.71% in Mar 2025
YoY Growth in quarter ended Mar 2026 is -15.69% vs 78.99% in Mar 2025
Half Yearly Results Snapshot (Consolidated) - Sep'25

Growth in half year ended Sep 2025 is 3.51% vs -3.90% in Sep 2024
Growth in half year ended Sep 2025 is 6.06% vs 34.29% in Sep 2024
Nine Monthly Results Snapshot (Consolidated) - Dec'25
YoY Growth in nine months ended Dec 2025 is 4.40% vs -3.09% in Dec 2024
YoY Growth in nine months ended Dec 2025 is -0.14% vs 35.18% in Dec 2024
Annual Results Snapshot (Consolidated) - Mar'26
YoY Growth in year ended Mar 2026 is 7.00% vs 1.71% in Mar 2025
YoY Growth in year ended Mar 2026 is -1.84% vs 38.73% in Mar 2025
About Insecticides India Ltd

Company Coordinates


