
Compare Inspirisys Sol. with Similar Stocks
Dashboard
High Management Efficiency with a high ROCE of 26.29%
High Debt Company with a Debt to Equity ratio (avg) of 22.05 times
Healthy long term growth as Operating profit has grown by an annual rate 58.15%
Flat results in Mar 26
With ROE of 42.6, it has a Attractive valuation with a 4.7 Price to Book Value
Majority shareholders : Promoters
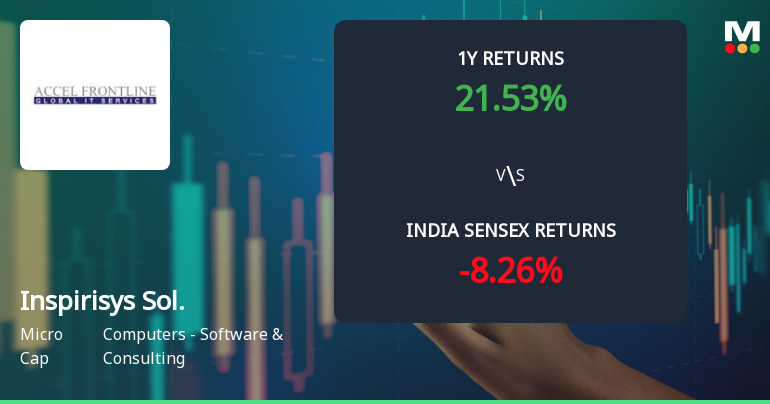
Market Beating performance in long term as well as near term
Stock DNA
Computers - Software & Consulting
INR 475 Cr (Micro Cap)
11.00
20
0.00%
-0.18
42.58%
4.77
Total Returns (Price + Dividend) 
Latest dividend: 1.5 per share ex-dividend date: Dec-11-2012
Risk Adjusted Returns v/s
Returns Beta

News
Inspirisys Solutions Ltd Technical Momentum Shifts Signal Bullish Outlook
Inspirisys Solutions Ltd has witnessed a notable shift in its technical momentum, moving from a mildly bullish stance to a more confident bullish trend. This change is underscored by a combination of positive signals from key technical indicators such as MACD, Bollinger Bands, and moving averages, alongside impressive stock returns that have outpaced the broader Sensex over multiple timeframes.
Read full news article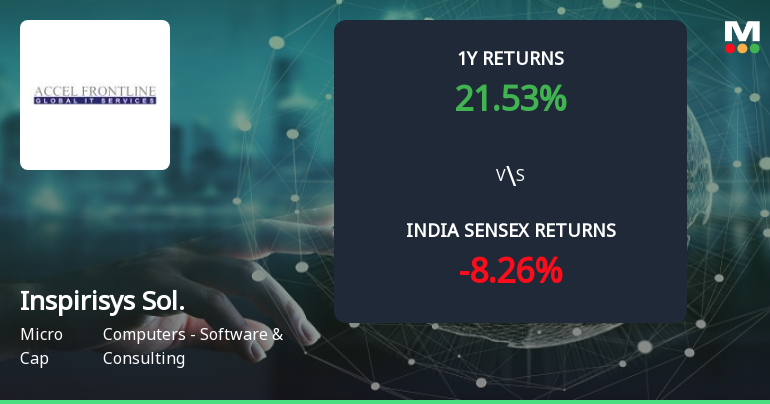
Golden Cross Confirmed: Do Inspirisys Solutions Ltd's Other Technical Indicators Agree?
The 50-day moving average has crossed above the 200-day moving average for Inspirisys Solutions Ltd, signalling a golden cross on 2 Jun 2026. While this technical event often suggests a shift towards bullish momentum, the broader technical and fundamental context presents a nuanced picture that merits closer examination.
Read full news article
Inspirisys Solutions Ltd Upgraded to Hold on Improved Technicals and Valuation
Inspirisys Solutions Ltd has seen its investment rating upgraded from Sell to Hold, reflecting notable improvements across technical indicators and valuation metrics, despite a flat financial quarter. The company’s micro-cap status, combined with strong long-term returns and attractive valuation ratios, underpin this revised outlook.
Read full news article Announcements
Book Closure For The Annual General Meeting For The FY 2025-2026
05-Jun-2026 | Source : BSEBook Closure for the Annual General Meeting for the FY 2025-2026
Annual General Meeting Notice Date Of AGM And Book Closure
05-Jun-2026 | Source : BSEAnnual General Meeting Notice date of AGM and Book Closure
Copy Of Newspaper Publication For AGM Notice Book Closure And E-Voting Process
05-Jun-2026 | Source : BSECopy of Newspaper Publication for AGM Notice Book Closure and E-Voting Process
Corporate Actions

No Upcoming Board Meetings

Inspirisys Solutions Ltd has declared 15% dividend, ex-date: 11 Dec 12

No Splits history available

No Bonus history available

No Rights history available
Quality key factors
Valuation key factors
Technicals key factors
 Technical Indicator Scale: Bearish, Mildly Bearish, Sideways, Mildly Bullish, Bullish Turned
 Shareholding Snapshot : Mar 2026
Shareholding Compare (%holding)
Promoters
None
Held by 0 Schemes
Held by 0 FIIs
Cac Holdings Corporation (69.95%)
Amicorp Trustees (india) Private Limited (11.27%)
16.12%
Quarterly Results Snapshot (Consolidated) - Mar'26 - YoY

YoY Growth in quarter ended Mar 2026 is 17.81% vs 21.99% in Mar 2025
YoY Growth in quarter ended Mar 2026 is -28.47% vs 227.81% in Mar 2025
Half Yearly Results Snapshot (Consolidated) - Sep'25

Growth in half year ended Sep 2025 is 8.50% vs -30.33% in Sep 2024
Growth in half year ended Sep 2025 is 116.29% vs 272.93% in Sep 2024
Nine Monthly Results Snapshot (Consolidated) - Dec'25
YoY Growth in nine months ended Dec 2025 is 24.76% vs -31.65% in Dec 2024
YoY Growth in nine months ended Dec 2025 is 65.26% vs 27,900.00% in Dec 2024
Annual Results Snapshot (Consolidated) - Mar'26
YoY Growth in year ended Mar 2026 is 22.60% vs -20.86% in Mar 2025
YoY Growth in year ended Mar 2026 is 90.25% vs 486.92% in Mar 2025
About Inspirisys Solutions Ltd

Company Coordinates


