Intl. Combustion

  • Market Cap: Micro Cap
  • Industry: Industrial Manufacturing
  • ISIN: INE403C01014
  • NSEID:
  • BSEID: 505737
INR
491.85
10.85 (2.26%)
BSENSE

Sep 18, 03:30 PM

BSE+NSE Vol: 328

  • Price Points
  • Score
  • Mojo Parameters
  • Total Return
  • News and Corporate Actions
  • Key factors
  • Shareholding
  • Financials
  • CompanyCV
stock-summaryPrice Point
High/Low

1Day

52 Week

Valuation
Technical
Day's Volume

CASH

328 (-31.92%) Volume

Shareholding (Jun 2026)

FII

0.00%

Held by 0 FIIs

DII

0.01%

Held by 0 DIIs

Promoter

52.88%

Why is International Combustion (India) Ltd falling/rising?

06-Sep-2026

As of 05-Sep, the stock price of International Combustion (India) Ltd is currently at 504.70, reflecting a short-term rise despite a significant year-to-date decline of 14.52%. Investor participation is decreasing, indicated by a sharp drop in delivery volume, suggesting caution despite recent gains.

As of 05-Sep, the stock price of International Combustion (India) Ltd is rising, currently at 504.70, reflecting a change of 4.0 (0.8%) upwards. This increase can be attributed to the stock outperforming its sector by 0.76% today and having gained consecutively for the last two days, with a total return of 1.96% during this period. <BR><BR>Despite this recent uptick, it is important to note that the stock has experienced significant declines over longer periods, with a year-to-date drop of 14.52% and a one-year decline of 37.01%. Additionally, the stock is currently trading higher than its 5-day and 20-day moving averages, although it remains below the 50-day, 100-day, and 200-day moving averages, indicating mixed performance trends.<BR><BR>Investor participation appears to be declining, as evidenced by a significant drop in delivery volume, which fell by 81.57% against the 5-day average on September 3. However, the stock remains liquid enough for trading, based on its average traded value. Overall, while the stock is experiencing a short-term rise, it is essential to consider the broader context of its performance and declining investor interest.

View full answer

Who are in the management team of Intl. Combustion?

01-Sep-2026

The management team of Intl. Combustion includes S Bagaria (Chairman), Indrajit Sen (Managing Director), R L Gaggar, Sandipan Chakravortty, Nayantara Palchoudhuri, and Srikumar Menon (Independent Directors), P R Sivasankar (Company Secretary), and Rana Pratap Singh (Whole-time Director), overseeing the company's operations and governance.

The management team of Intl. Combustion includes the following key members:<BR><BR>1. **S Bagaria** - Chairman (Non-Executive)<BR>2. **Indrajit Sen** - Managing Director<BR>3. **R L Gaggar** - Independent Director<BR>4. **Sandipan Chakravortty** - Independent Director<BR>5. **P R Sivasankar** - Company Secretary & Compliance Officer<BR>6. **Nayantara Palchoudhuri** - Independent Director<BR>7. **Rana Pratap Singh** - Whole-time Director<BR>8. **Srikumar Menon** - Independent Director<BR><BR>This team is responsible for overseeing the company's operations and governance.

View full answer

What does Intl. Combustion do?

01-Sep-2026

International Combustion (India) Limited is a micro-cap industrial manufacturing company, incorporated in 1936, with recent quarterly net sales of 66 Cr and a net loss of 4 Cr. The company has a market cap of 124 Cr and operates under a negative return on equity of -3.77%.

Overview:<BR>International Combustion (India) Limited operates in the industrial manufacturing sector and is categorized as a micro-cap company.<BR><BR>History:<BR>The company was incorporated in April 1936 and transitioned from a 100% subsidiary of International Combustion (Holding) (ICHL), UK, to a public limited company in 1974. The latest quarterly results reported net sales and net profit for June 2026.<BR><BR>Financial Snapshot:<BR>- Net Sales: 66 Cr (Quarterly Results - Jun 2026)<BR>- Net Profit: -4 Cr (Quarterly Results - Jun 2026)<BR>- Market Cap: INR 124 Cr (Micro Cap)<BR><BR>Key Metrics:<BR>- P/E: N/A<BR>- Industry P/E: 35<BR>- Dividend Yield: 0.79%<BR>- Debt-Equity: -0.01<BR>- Return on Equity: -3.77%<BR>- Price to Book: 0.92<BR><BR>Contact Details:<BR>Address: 11th Floor Plo No G-1 Sec-V, Block EP & GP Salt lake Electr Kolkata West Bengal : 700091<BR>Tel: 91-33-33153000<BR>Email: info@internationalcombustion.in<BR>Website: http://www.internationalcombustion.in

View full answer

Who are the peers of the Intl. Combustion?

01-Sep-2026

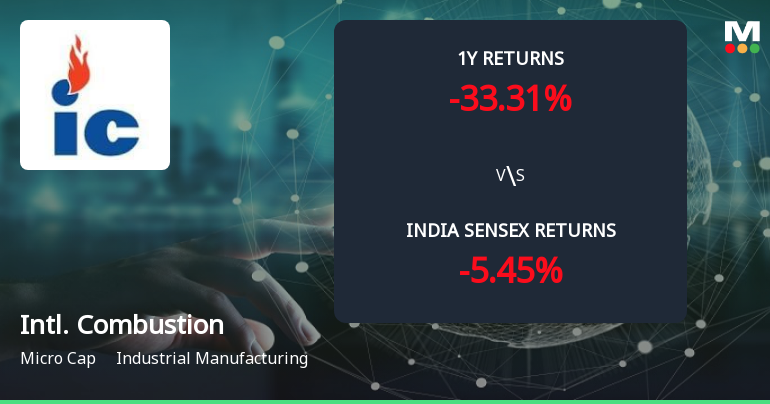
Peers of Intl. Combustion include Galaxy Agrico, Rishi Laser, ITL Industries, and others. Management risks vary, with Galaxy Agrico and Intl. Combustion rated below average, while Rishi Laser shows good growth; Intl. Combustion's 1-year return is -28.93%.

Peers: The peers of Intl. Combustion are Galaxy Agrico, Rishi Laser, ITL Industries, Chemtech Indust., Ducon Tech, Somi Conv.Belt., Rexnord Electr., Rudrabhish. Ent., Envirotech Sys., and Emkay Taps & Cut.<BR><BR>Quality Snapshot: Below Average management risk is observed at Galaxy Agrico, Ducon Tech, Somi Conv.Belt., and Intl. Combustion, while Average management risk is found at Rishi Laser, ITL Industries, Chemtech Indust., Rexnord Electr., and Rudrabhish. Ent. Good growth is noted at Rishi Laser, while Below Average growth is seen at Galaxy Agrico, Intl. Combustion, ITL Industries, Chemtech Indust., Ducon Tech, Somi Conv.Belt., and the rest. Excellent capital structure is present at Rexnord Electr. and Rudrabhish. Ent., while Good capital structure is found at Intl. Combustion and ITL Industries, and Average capital structure is noted at Chemtech Indust. and Somi Conv.Belt.<BR><BR>Return Snapshot: Galaxy Agrico has the highest 1-year return at 127.32%, while Chemtech Indust. has the lowest at -38.89%, with Intl. Combustion's 1-year return at -28.93% indicating a better performance than Chemtech Indust. Additionally, Ducon Tech, Chemtech Indust., Somi Conv.Belt., and Emkay Taps & Cut have negative six-month returns.

View full answer

How big is Intl. Combustion?

01-Sep-2026

As of 31st August, International Combustion (India) Ltd has a market capitalization of 124.00 Cr and reported net sales of 98.28 Cr with a net loss of 7.09 Cr over the latest four quarters.

As of 31st August, <BR><BR>Market Cap: International Combustion (India) Ltd has a market capitalization of 124.00 Cr, categorized as a Micro Cap.<BR><BR>Recent Quarterly Performance: The sum of Net Sales for the latest 4 quarters is 98.28 Cr, while the sum of Net Profit for the same period reflects a loss of 7.09 Cr.<BR><BR>Balance Sheet Snapshot: The reporting period for the balance sheet is March 2020, with Shareholder's Funds amounting to 94.25 Cr and Total Assets valued at 157.56 Cr.

View full answer

Should I buy, sell or hold International Combustion (India) Ltd?

30-Jul-2026

When is the next results date for International Combustion (India) Ltd?

23-Jul-2026

The next results date for International Combustion (India) Ltd is 30 July 2026.

The next results date for International Combustion (India) Ltd is scheduled for 30 July 2026.

View full answer

Are International Combustion (India) Ltd latest results good or bad?

07-Feb-2026

International Combustion (India) Ltd's latest results are concerning, with a net profit of ₹-2.65 crores in Q3 FY26, a 170.70% decline quarter-on-quarter, and a revenue drop of 12.80%. The company is facing significant operational challenges, reflected in a negative operating margin and a low return on equity, indicating a negative outlook and increased investment risk.

The latest results for International Combustion (India) Ltd are concerning. In Q3 FY26, the company reported a net profit of ₹-2.65 crores, which reflects a significant decline of 170.70% quarter-on-quarter. This loss indicates severe operational stress and a deterioration in profitability.<BR><BR>Revenue for the same quarter was ₹72.19 crores, down 12.80% from the previous quarter. Additionally, the operating margin fell to -0.68%, marking a quarterly low, which suggests that the company is struggling to maintain pricing power and manage costs effectively.<BR><BR>The return on equity (ROE) for the first half of FY26 is also troubling, at just 9.34%, which is the lowest in recent periods. This weak performance, combined with a lack of institutional interest and a significant drop in stock price—down 27.28% over the past year—paints a bleak picture for the company's future.<BR><BR>Overall, these results indicate that International Combustion is facing serious challenges, and the outlook appears negative, making it a risky investment at this time.

View full answer

How has been the historical performance of Intl. Combustion?

04-Nov-2025

Intl. Combustion experienced a decline in financial performance from Mar'19 to Mar'20, with net sales dropping from 134.16 Cr to 123.95 Cr, and profit before tax turning negative at -3.17 Cr. Overall, the company faced reduced revenues, profits, and negative cash flow during this period.

Answer:<BR>The historical performance of Intl. Combustion shows fluctuations in key financial metrics over the years.<BR><BR>Breakdown:<BR>Intl. Combustion's net sales decreased from 134.16 Cr in Mar'19 to 123.95 Cr in Mar'20, following a general upward trend from 99.95 Cr in Mar'16 to a peak of 134.16 Cr in Mar'19. The total operating income mirrored this decline, falling to 123.95 Cr in Mar'20 from 134.16 Cr in the previous year. Operating profit (PBDIT) also saw a significant drop, declining from 12.42 Cr in Mar'19 to 4.52 Cr in Mar'20, while profit before tax turned negative at -3.17 Cr in Mar'20, down from a positive 4.13 Cr in Mar'19. This trend continued with profit after tax, which fell to -1.87 Cr in Mar'20 from 3.57 Cr in the prior year. The company's total liabilities decreased slightly from 160.70 Cr in Mar'19 to 157.56 Cr in Mar'20, while total assets also saw a decline from 160.70 Cr to 157.56 Cr during the same period. Cash flow from operating activities turned negative at -4.00 Cr in Mar'20, contrasting with a positive inflow of 5.00 Cr in Mar'19. Overall, the financial data indicates a challenging year for Intl. Combustion, marked by declining revenues and profits.

View full answer

Is Intl. Combustion overvalued or undervalued?

01-Aug-2025

As of July 31, 2025, Intl. Combustion is fairly valued with a PE ratio of 13.59, an EV to EBITDA of 9.16, and a Price to Book Value of 1.52, making it more attractive than peers like Rail Vikas and Tube Investments, despite a year-to-date decline of -11.24% compared to the Sensex's 3.90% gain, while still showing strong long-term returns of 253.94% over three years and 433.07% over five years.

As of 31 July 2025, the valuation grade for Intl. Combustion has moved from very attractive to attractive, indicating a shift in market perception. The company is currently assessed as fairly valued. Key ratios include a PE ratio of 13.59, an EV to EBITDA of 9.16, and a Price to Book Value of 1.52, which suggest a reasonable valuation relative to its earnings and asset base.<BR><BR>In comparison to its peers, Intl. Combustion's valuation appears more favorable than companies like Rail Vikas, which is considered expensive with a PE ratio of 56.68, and Tube Investments, also very expensive at a PE of 81.25. Despite a recent decline in stock performance year-to-date, where Intl. Combustion has returned -11.24% compared to a 3.90% gain in the Sensex, its long-term performance over three and five years shows significant outperformance, with returns of 253.94% and 433.07%, respectively.

View full answer

Who are the top shareholders of the Intl. Combustion?

17-Jul-2025

The top shareholders of Intl. Combustion include promoters, with Tradelink Securities Limited holding 14.38%. Individual investors collectively own 40.93%, while there are no mutual funds or foreign institutional investors currently involved.

The top shareholders of Intl. Combustion include the promoters, who hold the majority of the shares. Among them, Tradelink Securities Limited has the highest holding at 14.38%. In terms of individual public shareholders, V Naga Raja Naidu holds 1.15%. Additionally, individual investors collectively own 40.93% of the company's shares. Notably, there are no mutual funds or foreign institutional investors (FIIs) currently holding shares in the company.

View full answer

What is the technical trend for Intl. Combustion?

09-Jun-2025

As of June 5, 2025, Intl. Combustion's technical trend is mildly bearish, influenced by bearish daily moving averages and mixed signals from the MACD and Bollinger Bands across different time frames.

As of 5 June 2025, the technical trend for Intl. Combustion has changed from bearish to mildly bearish. The weekly MACD is mildly bullish, while the monthly MACD remains bearish, indicating mixed signals across time frames. The Bollinger Bands show a mildly bullish stance on the weekly chart but are bearish on the monthly. Daily moving averages are bearish, which adds to the cautious outlook. The KST is bullish weekly but mildly bearish monthly, and Dow Theory indicates a mildly bearish trend on the weekly basis with no trend on the monthly. Overall, the current technical stance is mildly bearish, driven primarily by the bearish daily moving averages and mixed signals from the MACD and Bollinger Bands.

View full answer

Has Intl. Combustion declared dividend?

06-Jun-2025

International Combustion (India) Ltd has declared a 50% dividend, amounting to ₹5 per share, with an ex-date of August 28, 2024. While recent total returns have been negative, the company has shown significant growth over longer periods.

International Combustion (India) Ltd has declared a 50% dividend.<BR><BR>Dividend Details:<BR>- Percentage announced: 50%<BR>- Amount per share: 5<BR>- Ex-date: 28 Aug 24<BR><BR>Dividend Yield: 0.57%.<BR><BR>Total Returns by Period:<BR>In the last 6 months, the price return was -7.7%, the dividend return was 0%, resulting in a total return of -7.7%.<BR><BR>Over the past year, the price return was -47.45%, with a dividend return of 0.29%, leading to a total return of -47.16%.<BR><BR>In the 2-year period, the price return was 66.29%, the dividend return was 1.54%, culminating in a total return of 67.83%.<BR><BR>For the 3-year period, the price return was 214.73%, the dividend return was 4.07%, resulting in a total return of 218.8%.<BR><BR>In the 4-year period, the price return was 315.95%, the dividend return was 4.58%, leading to a total return of 320.53%.<BR><BR>Over the last 5 years, the price return was 668.17%, with a dividend return of 8.03%, resulting in a total return of 676.2%.<BR><BR>Overall, while International Combustion has declared a dividend, the recent total returns over shorter periods have been negative, indicating potential challenges in the company's performance. However, the longer-term returns show significant growth, suggesting a recovery or strong performance in the past.

View full answer
iScoreScore
Click here to find our call on this stock
Strong Sell
Sell
Hold
Buy
Strong Buy

Dashboard

1

Poor Management Efficiency with a low ROE of 8.07%

  • The company has been able to generate a Return on Equity (avg) of 8.07% signifying low profitability per unit of shareholders funds
2

Poor long term growth as Operating profit has grown by an annual rate -222.51% of over the last 5 years

 
3

The company has declared Negative results for the last 3 consecutive quarters

4

Risky - Negative Operating Profits

5

Consistent Underperformance against the benchmark over the last 3 years

stock-summaryMojo Parameters

Mojo Parameters

Loading Valuation Snapshot...

Stock DNA

stock-summary
Industry

Industrial Manufacturing

stock-summary
Market cap

INR 115 Cr (Micro Cap)

stock-summary
P/E

NA (Loss Making)

stock-summary
Industry P/E

34

stock-summary
Dividend Yield

0.00%

stock-summary
Debt Equity

-0.01

stock-summary
Return on Equity

-3.77%

stock-summary
Price to Book

0.88

Revenue and Profits:
Net Sales:
66 Cr
(Quarterly Results - Jun 2026)
Net Profit:
-4 Cr
stock-summaryTotal Returns
Total Returns (Price + Dividend) stock-summary
Dividend Yield (0%)
TimePeriod
Price Return
Dividend Return
Total Return
3 Months
1.66%
0%
1.66%
6 Months
22.24%
0%
22.24%
1 Year
-37.9%
0%
-37.9%
2 Years
-63.24%
0.31%
-62.93%
3 Years
-58.59%
0.83%
-57.76%
4 Years
37.29%
3.68%
40.97%
5 Years
138.82%
6.32%
145.14%

Latest dividend: 4 per share ex-dividend date: Sep-03-2025

Risk Adjusted Returns v/s stock-summary
Returns Beta
Icon
Beta has not been calculated since enough price history is not available
stock-summaryNews & Corporate Actions

Announcements stock-summary

Announcement under Regulation 30 (LODR)-Newspaper Publication

15-Sep-2026 | Source : BSE

Newspaper publication regarding the Special Window for Transfer and Dematerialization of Shares Physical Securities pursuant to SEBI Circular.

Announcement under Regulation 30 (LODR)-Credit Rating

05-Sep-2026 | Source : BSE

Intimation of Revised Credit Rating

Reappointment Of Executive Director (Whole Time Director)

20-Aug-2026 | Source : BSE

Reappointment of Mr. Rana Pratap Singh Executive Director (Whole Time Director) of the Company in the 90th AGM held on 19th August 2026.

Corporate Actions stock-summary

stock-summary
BOARD MEETING

No Upcoming Board Meetings

stock-summary
DIVIDEND

International Combustion (India) Ltd has declared 40% dividend, ex-date: 03 Sep 25

stock-summary
SPLITS

No Splits history available

stock-summary
BONUS

No Bonus history available

stock-summary
RIGHTS

No Rights history available

stock-summaryKey Factors

Quality key factors stock-summary

Factor
Value
Sales Growth (5y)
18.75%
EBIT Growth (5y)
-222.51%
EBIT to Interest (avg)
4.54
Debt to EBITDA (avg)
0.27
Net Debt to Equity (avg)
-0.01
Sales to Capital Employed (avg)
1.78
Tax Ratio
18.99%
Dividend Payout Ratio
0
Pledged Shares
0
Institutional Holding
0.01%
ROCE (avg)
10.63%
ROE (avg)
8.07%

Valuation key factors

Factor
Value
P/E Ratio
NA (Loss Making)
Industry P/E
34
Price to Book Value
0.91
EV to EBIT
-26.88
EV to EBITDA
48.34
EV to Capital Employed
0.90
EV to Sales
0.39
PEG Ratio
NA
Dividend Yield
NA
ROCE (Latest)
-0.36%
ROE (Latest)
-3.77%

Technicals key factors

Indicator
Weekly
Monthly
MACD
Bearish
Mildly Bullish
RSI
No Signal
No Signal
Bollinger Bands
Bearish
Bearish
Moving Averages
Mildly Bullish (Daily)
KST
Mildly Bearish
Bearish
Dow Theory
Mildly Bullish
Mildly Bearish
stock-summary Technical Indicator Scale: Bearish, Mildly Bearish, Sideways, Mildly Bullish, Bullish  Turned 
stock-summaryShareholding
Shareholding Snapshot : Jun 2026stock-summary
Shareholding Compare (%holding) stock-summary
Majority shareholders

Promoters

Pledged Promoter Holdings

None

Mutual Funds

Held by 0 Schemes

FIIs

Held by 0 FIIs

Promoter with highest holding

Tradelink Securities Limited (14.38%)

Highest Public shareholder

Popatlal Punamchand Shah (1.5%)

Individual Investors Holdings

39.32%

stock-summaryFinancial
[
  {
    "link": "quarterly",
    "btn_text": "All Quarterly Results",
    "header": "Quarterly Results Snapshot (Standalone) - Jun'26 - YoY",
    "rhs": [
      {
        "prefix": "Net Sales ",
        "suffix": "YoY Growth in quarter ended Jun 2026 is 10.05% vs 0.60% in Jun 2025",
        "dir": 1
      },
      {
        "prefix": "Standalone Net Profit ",
        "suffix": "YoY Growth in quarter ended Jun 2026 is -329.03% vs -152.54% in Jun 2025",
        "dir": -1
      }
    ],
    "table": {
      "header": [
        "Jun'26",
        "Jun'25",
        "Change(%)"
      ],
      "body": [
        {
          "field": "Net Sales",
          "val1": "65.91",
          "val2": "59.89",
          "chgp": "10.05%",
          "chgp_class": "positive"
        },
        {
          "field": "Operating Profit (PBDIT) excl Other Income",
          "val1": "-2.55",
          "val2": "1.34",
          "chgp": "-290.30%",
          "chgp_class": "negative"
        },
        {
          "field": "Interest",
          "val1": "0.83",
          "val2": "1.04",
          "chgp": "-20.19%",
          "chgp_class": "positive"
        },
        {
          "field": "Exceptional Items",
          "val1": "0.00",
          "val2": "0.00",
          "chgp": "",
          "chgp_class": "neutral"
        },
        {
          "field": "Standalone Net Profit",
          "val1": "-3.99",
          "val2": "-0.93",
          "chgp": "-329.03%",
          "chgp_class": "negative"
        },
        {
          "field": "Operating Profit Margin (Excl OI)",
          "val1": "-3.87%",
          "val2": "2.24%",
          "chgp": "-6.11%",
          "chgp_class": "negative"
        }
      ]
    }
  },
  {
    "link": "half-yearly",
    "btn_text": "All Half Yearly Results",
    "header": "Half Yearly Results Snapshot (Standalone) - Sep'25",
    "rhs": [
      {
        "prefix": "Net Sales ",
        "suffix": " Growth in half year ended Sep 2025 is 9.61% vs -13.22% in Sep 2024",
        "dir": 1
      },
      {
        "prefix": "Standalone Net Profit ",
        "suffix": " Growth in half year ended Sep 2025 is -140.91% vs -81.56% in Sep 2024",
        "dir": -1
      }
    ],
    "table": {
      "header": [
        "Sep'25",
        "Sep'24",
        "Change(%)"
      ],
      "body": [
        {
          "field": "Net Sales",
          "val1": "135.22",
          "val2": "123.36",
          "chgp": "9.61%",
          "chgp_class": "positive"
        },
        {
          "field": "Operating Profit (PBDIT) excl Other Income",
          "val1": "3.56",
          "val2": "7.56",
          "chgp": "-52.91%",
          "chgp_class": "negative"
        },
        {
          "field": "Interest",
          "val1": "1.74",
          "val2": "2.87",
          "chgp": "-39.37%",
          "chgp_class": "positive"
        },
        {
          "field": "Exceptional Items",
          "val1": "0.00",
          "val2": "0.00",
          "chgp": "",
          "chgp_class": "neutral"
        },
        {
          "field": "Standalone Net Profit",
          "val1": "-0.81",
          "val2": "1.98",
          "chgp": "-140.91%",
          "chgp_class": "negative"
        },
        {
          "field": "Operating Profit Margin (Excl OI)",
          "val1": "2.63%",
          "val2": "6.13%",
          "chgp": "-3.50%",
          "chgp_class": "negative"
        }
      ]
    }
  },
  {
    "link": "nine-monthly",
    "btn_text": "All Nine Monthly Results",
    "header": "Nine Monthly Results Snapshot (Standalone) - Dec'25",
    "rhs": [
      {
        "prefix": "Net Sales ",
        "suffix": "YoY Growth in nine months ended Dec 2025 is 0.61% vs -4.34% in Dec 2024",
        "dir": 1
      },
      {
        "prefix": "Standalone Net Profit ",
        "suffix": "YoY Growth in nine months ended Dec 2025 is -142.45% vs -49.85% in Dec 2024",
        "dir": -1
      }
    ],
    "table": {
      "header": [
        "Dec'25",
        "Dec'24",
        "Change(%)"
      ],
      "body": [
        {
          "field": "Net Sales",
          "val1": "207.41",
          "val2": "206.15",
          "chgp": "0.61%",
          "chgp_class": "positive"
        },
        {
          "field": "Operating Profit (PBDIT) excl Other Income",
          "val1": "3.07",
          "val2": "16.37",
          "chgp": "-81.25%",
          "chgp_class": "negative"
        },
        {
          "field": "Interest",
          "val1": "2.51",
          "val2": "4.09",
          "chgp": "-38.63%",
          "chgp_class": "positive"
        },
        {
          "field": "Exceptional Items",
          "val1": "0.00",
          "val2": "0.00",
          "chgp": "",
          "chgp_class": "neutral"
        },
        {
          "field": "Standalone Net Profit",
          "val1": "-3.46",
          "val2": "8.15",
          "chgp": "-142.45%",
          "chgp_class": "negative"
        },
        {
          "field": "Operating Profit Margin (Excl OI)",
          "val1": "1.48%",
          "val2": "7.94%",
          "chgp": "-6.46%",
          "chgp_class": "negative"
        }
      ]
    }
  },
  {
    "link": "annual",
    "btn_text": "All Annual Results",
    "header": "Annual Results Snapshot (Standalone) - Mar'26",
    "rhs": [
      {
        "prefix": "Net Sales ",
        "suffix": "YoY Growth in year ended Mar 2026 is 0.14% vs -1.28% in Mar 2025",
        "dir": 1
      },
      {
        "prefix": "Standalone Net Profit ",
        "suffix": "YoY Growth in year ended Mar 2026 is -115.99% vs -25.06% in Mar 2025",
        "dir": -1
      }
    ],
    "table": {
      "header": [
        "Mar'26",
        "Mar'25",
        "Change(%)"
      ],
      "body": [
        {
          "field": "Net Sales",
          "val1": "293.40",
          "val2": "292.98",
          "chgp": "0.14%",
          "chgp_class": "positive"
        },
        {
          "field": "Operating Profit (PBDIT) excl Other Income",
          "val1": "6.30",
          "val2": "23.43",
          "chgp": "-73.11%",
          "chgp_class": "negative"
        },
        {
          "field": "Interest",
          "val1": "3.46",
          "val2": "5.00",
          "chgp": "-30.80%",
          "chgp_class": "positive"
        },
        {
          "field": "Exceptional Items",
          "val1": "-0.51",
          "val2": "0.00",
          "chgp": "",
          "chgp_class": "neutral"
        },
        {
          "field": "Standalone Net Profit",
          "val1": "-2.39",
          "val2": "14.95",
          "chgp": "-115.99%",
          "chgp_class": "negative"
        },
        {
          "field": "Operating Profit Margin (Excl OI)",
          "val1": "2.15%",
          "val2": "8.00%",
          "chgp": "-5.85%",
          "chgp_class": "negative"
        }
      ]
    }
  }
]

Quarterly Results Snapshot (Standalone) - Jun'26 - YoYstock-summary

Jun'26
Jun'25
Change(%)
Net Sales
65.91
59.89
10.05%
Operating Profit (PBDIT) excl Other Income
-2.55
1.34
-290.30%
Interest
0.83
1.04
-20.19%
Exceptional Items
0.00
0.00
Standalone Net Profit
-3.99
-0.93
-329.03%
Operating Profit Margin (Excl OI)
-3.87%
2.24%
-6.11%
Values in Rs Cr.
Direction Arrows
Net Sales

YoY Growth in quarter ended Jun 2026 is 10.05% vs 0.60% in Jun 2025

Direction Arrows
Standalone Net Profit

YoY Growth in quarter ended Jun 2026 is -329.03% vs -152.54% in Jun 2025

Half Yearly Results Snapshot (Standalone) - Sep'25stock-summary

Sep'25
Sep'24
Change(%)
Net Sales
135.22
123.36
9.61%
Operating Profit (PBDIT) excl Other Income
3.56
7.56
-52.91%
Interest
1.74
2.87
-39.37%
Exceptional Items
0.00
0.00
Standalone Net Profit
-0.81
1.98
-140.91%
Operating Profit Margin (Excl OI)
2.63%
6.13%
-3.50%
Values in Rs Cr.
Direction Arrows
Net Sales

Growth in half year ended Sep 2025 is 9.61% vs -13.22% in Sep 2024

Direction Arrows
Standalone Net Profit

Growth in half year ended Sep 2025 is -140.91% vs -81.56% in Sep 2024

Nine Monthly Results Snapshot (Standalone) - Dec'25stock-summary

Dec'25
Dec'24
Change(%)
Net Sales
207.41
206.15
0.61%
Operating Profit (PBDIT) excl Other Income
3.07
16.37
-81.25%
Interest
2.51
4.09
-38.63%
Exceptional Items
0.00
0.00
Standalone Net Profit
-3.46
8.15
-142.45%
Operating Profit Margin (Excl OI)
1.48%
7.94%
-6.46%
Values in Rs Cr.
Direction Arrows
Net Sales

YoY Growth in nine months ended Dec 2025 is 0.61% vs -4.34% in Dec 2024

Direction Arrows
Standalone Net Profit

YoY Growth in nine months ended Dec 2025 is -142.45% vs -49.85% in Dec 2024

Annual Results Snapshot (Standalone) - Mar'26stock-summary

Mar'26
Mar'25
Change(%)
Net Sales
293.40
292.98
0.14%
Operating Profit (PBDIT) excl Other Income
6.30
23.43
-73.11%
Interest
3.46
5.00
-30.80%
Exceptional Items
-0.51
0.00
Standalone Net Profit
-2.39
14.95
-115.99%
Operating Profit Margin (Excl OI)
2.15%
8.00%
-5.85%
Values in Rs Cr.
Direction Arrows
Net Sales

YoY Growth in year ended Mar 2026 is 0.14% vs -1.28% in Mar 2025

Direction Arrows
Standalone Net Profit

YoY Growth in year ended Mar 2026 is -115.99% vs -25.06% in Mar 2025

stock-summaryCompany CV
About International Combustion (India) Ltd stock-summary
stock-summary
International Combustion (India) Ltd
Micro Cap
Industrial Manufacturing
International Combustion (India) Limited, promoted by International Combustion (Holding) (ICHL), UK, which was taken over by Northern Engineering Industries, was incorporated as a private limited company in April, 1936. It was a 100% subsidiary of ICHL till 1974 when it became public limited company, thereby reducing the foreign shareholding to 60%. It then acquired the present name. The foreign holding was further diluted to 39.12% in 1978.
Company Coordinates stock-summary
Company Details
11th Floor Plo No G-1 Sec-V, Block EP & GP Salt lake Electr Kolkata West Bengal : 700091
stock-summary
Tel: 91-33-33153000
stock-summary
info@internationalcombustion.in
Registrar Details
CB Management Services Pvt Ltd , (Formerly Choksey Bhargava & Co Ltd) , P-22, P 22 Bondel Road, Calcutta