
Compare International Ge with Similar Stocks
Stock DNA
Diversified Commercial Services
INR 15,964 Cr (Small Cap)
27.00
32
1.33%
-0.09
38.34%
10.88
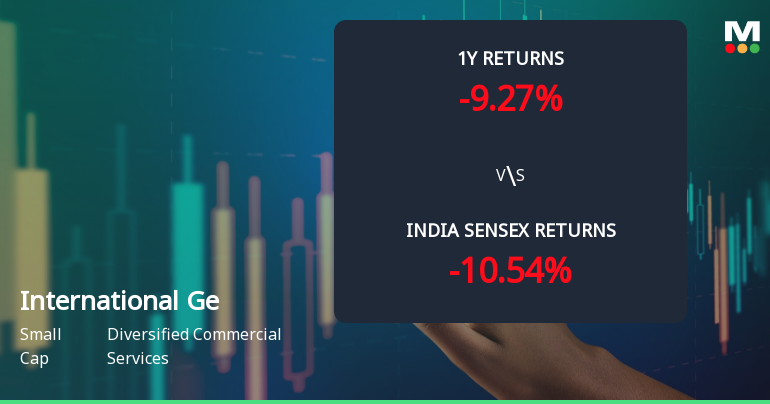
Total Returns (Price + Dividend) 
Latest dividend: 2.5 per share ex-dividend date: Feb-17-2026
Risk Adjusted Returns v/s
Returns Beta

News
International Gemmological Institute (India) Ltd Technical Momentum Shifts to Bullish
International Gemmological Institute (India) Ltd has experienced a notable shift in its technical momentum, upgrading from a mildly bullish to a bullish trend. Despite a slight dip in the stock price on 9 June 2026, the underlying technical indicators suggest strengthening momentum, positioning the small-cap stock favourably within the diversified commercial services sector.
Read full news article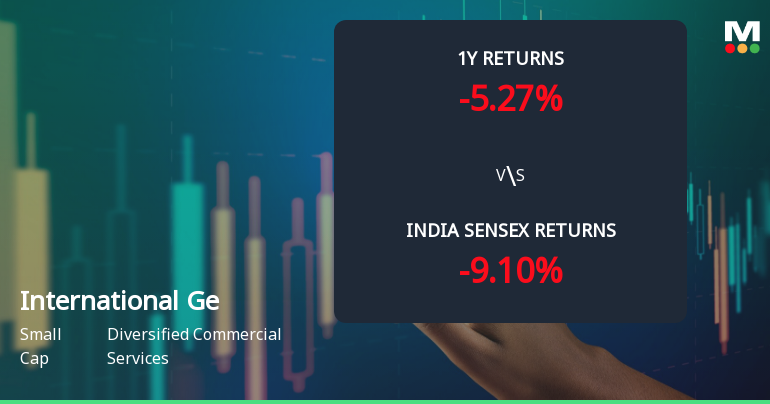
International Gemmological Institute (India) Ltd Sees Technical Momentum Shift Amid Mixed Returns
International Gemmological Institute (India) Ltd (IGI India) has experienced a notable shift in its technical momentum, moving from a bullish to a mildly bullish trend as of early June 2026. Despite a recent decline in share price, the stock’s technical indicators present a nuanced picture, reflecting both resilience and caution amid broader market pressures.
Read full news article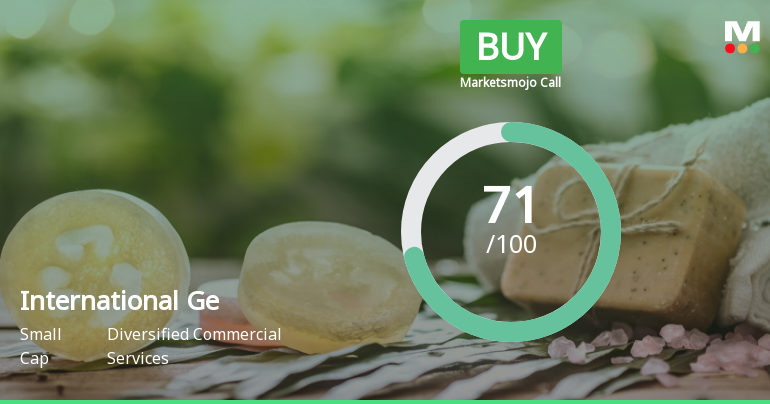
International Gemmological Institute (India) Ltd is Rated Buy
International Gemmological Institute (India) Ltd is rated 'Buy' by MarketsMOJO, with this rating last updated on 20 May 2026. However, the analysis and financial metrics discussed here reflect the stock's current position as of 01 June 2026, providing investors with the most up-to-date insight into the company’s performance and outlook.
Read full news article Announcements
Announcement under Regulation 30 (LODR)-Analyst / Investor Meet - Intimation
03-Jun-2026 | Source : BSEIntimation of the schedule of Analyst/Institutional Investor meeting
Announcement under Regulation 30 (LODR)-Analyst / Investor Meet - Intimation
26-May-2026 | Source : BSEIntimation of Schedule of Analyst/Institutional Investor meeting
Announcement under Regulation 30 (LODR)-Newspaper Publication
22-May-2026 | Source : BSENewspaper Publication of the Audited Financial Results for the quarter and financial year ended March 31 2026
Corporate Actions

No Upcoming Board Meetings

International Gemmological Institute (India) Ltd has declared 125% dividend, ex-date: 17 Feb 26

No Splits history available

No Bonus history available

No Rights history available
Quality key factors
Valuation key factors
Technicals key factors
 Technical Indicator Scale: Bearish, Mildly Bearish, Sideways, Mildly Bullish, Bullish Turned
 Shareholding Snapshot : Mar 2026
Shareholding Compare (%holding)
Promoters
None
Held by 19 Schemes (5.23%)
Held by 94 FIIs (8.6%)
Bcp Asia Ii Topco Pte Ltd (76.55%)
Icici Prudential Smallcap Index Fund (1.89%)
6.62%
Quarterly Results Snapshot (Consolidated) - Mar'26 - QoQ

QoQ Growth in quarter ended Mar 2026 is 15.29% vs 5.24% in Dec 2025
QoQ Growth in quarter ended Mar 2026 is 33.48% vs 3.67% in Dec 2025
Half Yearly Results Snapshot (Standalone) - Jun'25
Not Applicable: The company has declared_date for only one period
Not Applicable: The company has declared_date for only one period
Nine Monthly Results Snapshot (Standalone) - Sep'25
Not Applicable: The company has declared_date for only one period
Not Applicable: The company has declared_date for only one period
Annual Results Snapshot (Consolidated) - Dec'25

YoY Growth in year ended Dec 2025 is 16.71% vs 17.28% in Dec 2024
YoY Growth in year ended Dec 2025 is 24.41% vs 29.15% in Dec 2024
About International Gemmological Institute (India) Ltd

Company Coordinates


