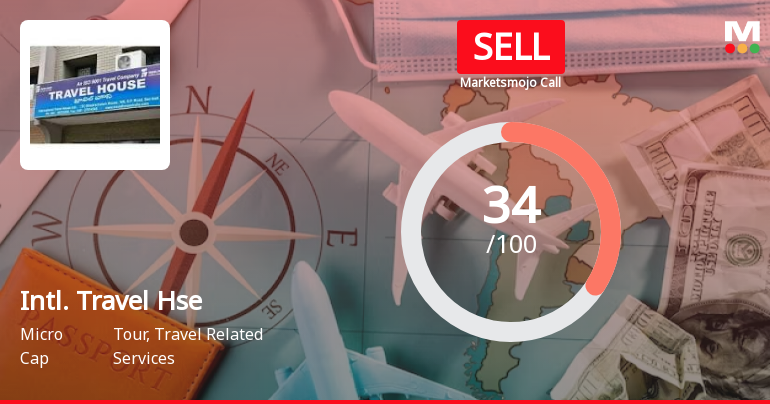
Intl. Travel Hse

  • Market Cap: Micro Cap
  • Industry: Tour, Travel Related Services
  • ISIN: INE262B01016
  • NSEID:
  • BSEID: 500213
INR
314.60
-3.5 (-1.1%)
BSENSE

Jul 22, 03:30 PM

BSE+NSE Vol: 1.09 k

  • Price Points
  • Score
  • Mojo Parameters
  • Total Return
  • News and Corporate Actions
  • Key factors
  • Shareholding
  • Financials
  • CompanyCV
stock-summaryPrice Point
High/Low

1Day

52 Week

Valuation
Technical
Day's Volume

CASH

1.09 k (-41.78%) Volume

Shareholding (Mar 2026)

FII

0.00%

Held by 0 FIIs

DII

0.01%

Held by 0 DIIs

Promoter

61.69%

Why is International Travel House Ltd falling/rising?

22-Jul-2026

As of 21-Jul, the stock price of International Travel House Ltd is currently at 318.10, reflecting a decline of 9.6 (-2.93%). Despite some recent gains, the stock has significantly underperformed year-to-date and over the past year, with a negative trend exacerbated by today's losses and sector underperformance.

As of 21-Jul, the stock price of International Travel House Ltd is falling, currently at 318.10, which reflects a decrease of 9.6 (-2.93%). This decline is evident as the stock opened with a loss of 2.04% today and reached an intraday low of Rs 311.05, marking a drop of 5.08%. Additionally, the stock has underperformed its sector by 4.12% today. <BR><BR>Despite some positive trends over the past week and month, where the stock has shown gains of 0.76% and 2.80% respectively, its year-to-date performance is significantly negative at -15.13%, and it has dropped 36.70% over the past year. The moving averages indicate that while the stock is higher than the 20-day, 50-day, and 100-day averages, it is lower than the 5-day and 200-day averages, suggesting a mixed performance trend.<BR><BR>Moreover, while there has been a rise in investor participation with a 3.02% increase in delivery volume against the 5-day average, the overall liquidity remains adequate for trading. However, the current negative price movement and underperformance against the sector are key factors contributing to the stock's decline.

View full answer

Should I buy, sell or hold International Travel House Ltd?

22-Jul-2026

Are International Travel House Ltd latest results good or bad?

11-Jul-2026

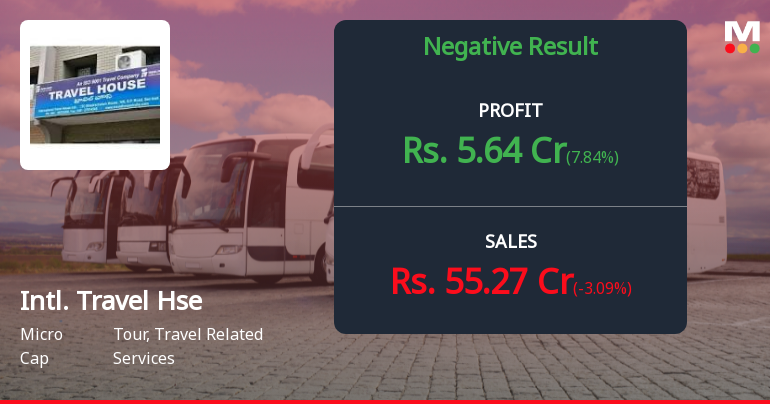
International Travel House Ltd's latest results are concerning, with a 3.09% decline in net sales to ₹55.27 crores and a year-on-year net profit drop of 17.90%. Despite being debt-free, the company faces challenges with four consecutive quarters of revenue decline and compressing margins, indicating unfavorable performance.

The latest results for International Travel House Ltd indicate a concerning trend. For the quarter ending June 2026, the company reported net sales of ₹55.27 crores, which represents a sequential decline of 3.09% and marks the lowest quarterly revenue in recent periods. Additionally, operating margins have compressed to 14.08%, down from 14.24% in the previous quarter, reflecting rising costs amidst declining revenues.<BR><BR>Net profit for the quarter was ₹5.64 crores, showing a modest sequential increase of 7.84% from the previous quarter, but this is a significant decline of 17.90% year-on-year compared to ₹6.87 crores in the same quarter last year. The PAT margin also decreased to 10.20%, down from 12.05% a year ago.<BR><BR>Overall, the company has faced four consecutive quarters of revenue decline, raising questions about its competitive positioning in an industry that should be recovering post-pandemic. While International Travel House maintains a debt-free balance sheet, the inability to generate growth during peak travel season is a significant concern. This combination of declining revenues and compressing margins suggests that the latest results are not favorable and point to potential challenges ahead for the company.

View full answer

How big is Intl. Travel Hse?

11-Jun-2026

As of 10th June, International Travel House Ltd has a market capitalization of 238.00 Cr, with recent Net Sales of 231.64 Cr and a Net Profit of 18.47 Cr. Shareholder's Funds were 165.37 Cr, and Total Assets amounted to 227.93 Cr.

As of 10th June, International Travel House Ltd has a market capitalization of 238.00 Cr, categorizing it as a Micro Cap company.<BR><BR>In the latest four quarters, the company reported Net Sales of 231.64 Cr and a Net Profit of 18.47 Cr.<BR><BR>For the latest annual period ending March 2025, the Shareholder's Funds were 165.37 Cr, and the Total Assets amounted to 227.93 Cr.

View full answer

Who are in the management team of Intl. Travel Hse?

11-Jun-2026

The management team of Intl. Travel Hse includes Nakul Anand (Chairman), Ashwin Moodliar (Managing Director), and several Independent Non-Executive Directors: Pradeep Vasant Dhobale, Vrinda Sarup, Homi Phiroze Ranina, and Subrahmoneyan Chandra Sekhar, along with Non-Executive Director Jagdish Singh.

The management team of Intl. Travel Hse includes the following members:<BR><BR>1. **Nakul Anand** - Chairman & Non-Executive Director<BR>2. **Pradeep Vasant Dhobale** - Independent Non-Executive Director<BR>3. **Vrinda Sarup** - Independent Non-Executive Director<BR>4. **Homi Phiroze Ranina** - Independent Non-Executive Director<BR>5. **Subrahmoneyan Chandra Sekhar** - Independent Non-Executive Director<BR>6. **Jagdish Singh** - Non-Executive Director<BR>7. **Ashwin Moodliar** - Managing Director<BR><BR>If you need more details about any specific member or their roles, feel free to ask!

View full answer

Who are the peers of the Intl. Travel Hse?

11-Jun-2026

Peers of Intl. Travel Hse include Thomas Cook (I), Easy Trip Planning, Yatra Online, and others. Intl. Travel Hse has average management risk, good growth, and a 1-year return of -40.65%, higher than Landmark Global's -73.37% but lower than Yatra Online's 0.20%.

Peers: The peers of Intl. Travel Hse are Thomas Cook (I), Easy Trip Plann., Yatra Online, LGT Business, Landmark Global, Wise Travel, Party Cruisers, Voler Car, and TSC India.<BR><BR>Quality Snapshot: Excellent management risk is observed at LGT Business, while Average management risk is found at Thomas Cook (I), Intl. Travel Hse, and Voler Car, and the rest. Below Average management risk is noted at Yatra Online and Landmark Global. Growth is Excellent at Thomas Cook (I), Wise Travel, and Party Cruisers, while Good growth is seen at Intl. Travel Hse, Yatra Online, and Voler Car, and the rest. Below Average growth is present at Easy Trip Plann. and Landmark Global. Capital Structure is Excellent at Easy Trip Plann., Intl. Travel Hse, LGT Business, Party Cruisers, and the rest, while Good capital structure is found at Thomas Cook (I), Yatra Online, and Wise Travel, and Average capital structure is noted at TSC India.<BR><BR>Return Snapshot: The peer with the highest 1-year return is Yatra Online at 0.20%, while the peer with the lowest is Landmark Global at -73.37%. Intl. Travel Hse's 1-year return is -40.65%, which is significantly lower than Yatra Online's return but higher than Landmark Global's. Additionally, LGT Business, Landmark Global, and Intl. Travel Hse have negative six-month returns.

View full answer

What does Intl. Travel Hse do?

10-Jun-2026

International Travel House Ltd is a leading Indian travel management company providing travel-related services, with a market cap of INR 238 Cr and reported net sales of 57 Cr and net profit of 5 Cr for Q1 2026. The company has a P/E ratio of 10.00 and a dividend yield of 1.83%.

Overview:<BR>International Travel House Ltd is one of India's leading travel management companies engaged in providing travel-related services to travelers in India and abroad, operating within the Tour and Travel Related Services industry and classified as a Micro Cap.<BR><BR>History:<BR>The company was originally incorporated as Indian Exploration Pvt Ltd on June 29, 1981, and acquired its current name in 1992. The latest quarterly results reported net sales and net profit for the period ending March 2026.<BR><BR>Financial Snapshot:<BR>- Net Sales: 57 Cr (Quarterly Results - Mar 2026)<BR>- Net Profit: 5 Cr (Quarterly Results - Mar 2026)<BR>- Market Cap: INR 238 Cr (Micro Cap)<BR><BR>Key Metrics:<BR>- P/E: 10.00<BR>- Industry P/E: 34<BR>- Dividend Yield: 1.83%<BR>- Debt Equity: -0.68<BR>- Return on Equity: 13.59%<BR>- Price to Book: 1.34<BR><BR>Contact Details:<BR>Address: Travel House T2 Community Cent, Sheikh Sarai Phase I New Delhi New Delhi : 110017<BR>Tel: 91-11-26017808<BR>Email: travelhouse@ith.co.in<BR>Website: http://www.travelhouseindia.com

View full answer

When is the next results date for International Travel House Ltd?

08-Jan-2026

The next results date for International Travel House Ltd is 14 January 2026.

The next results date for International Travel House Ltd is scheduled for 14 January 2026.

View full answer

How has been the historical performance of Intl. Travel Hse?

14-Oct-2025

Intl. Travel Hse has shown significant recovery and growth since Mar'21, with net sales increasing from 59.39 Cr to 235.63 Cr by Mar'25, and turning profitable with a profit after tax of 27.15 Cr. Total assets grew from 194.15 Cr in Mar'20 to 227.93 Cr in Mar'25, indicating a strong financial trajectory.

Answer:<BR>The historical performance of Intl. Travel Hse shows a significant recovery and growth in recent years, particularly from Mar'21 onwards.<BR><BR>Breakdown:<BR>Intl. Travel Hse's net sales have shown a steady increase, rising from 59.39 Cr in Mar'21 to 235.63 Cr in Mar'25. The total operating income followed a similar trend, reaching 235.63 Cr in Mar'25, up from 184.05 Cr in Mar'23 and 94.21 Cr in Mar'22. The company has also improved its operating profit, which was negative in Mar'22 and Mar'21, but turned positive with 44.15 Cr in Mar'25. Profit before tax has increased to 36.79 Cr in Mar'25 from a loss of 45.07 Cr in Mar'21. Profit after tax also reflects this positive trend, with 27.15 Cr in Mar'25 compared to a loss of 45.07 Cr in Mar'21. The company's total assets have grown from 194.15 Cr in Mar'20 to 227.93 Cr in Mar'25, while total liabilities increased from 140.44 Cr in Mar'21 to 227.93 Cr in Mar'25. Cash flow from operating activities has been positive, with 37 Cr in Mar'25, although cash flow from investing activities has been negative at -15 Cr. Overall, the financial metrics indicate a strong recovery and growth trajectory for Intl. Travel Hse in recent years.

View full answer

Who are the top shareholders of the Intl. Travel Hse?

17-Jul-2025

The top shareholders of Intl. Travel Hse are Itc Hotels Limited with 48.96%, followed by public shareholder Vaibhav Doshi at 3.14%, and individual investors who own 32.83%. There are no mutual funds or foreign institutional investors currently holding shares.

The top shareholders of Intl. Travel Hse include Itc Hotels Limited, which holds the largest stake at 48.96%. The highest public shareholder is Vaibhav Doshi, with a holding of 3.14%. Additionally, individual investors collectively own 32.83% of the company. There are currently no mutual funds or foreign institutional investors holding shares in Intl. Travel Hse.

View full answer

Is Intl. Travel Hse overvalued or undervalued?

09-Jun-2025

As of April 30, 2025, Intl. Travel Hse is considered undervalued with an attractive valuation grade, featuring a PE ratio of 14.91, an EV to EBITDA of 8.21, and a PEG ratio of 0.76, especially when compared to peers like I R C T C and Thomas Cook (I), despite recent underperformance against the Sensex.

As of 30 April 2025, the valuation grade for Intl. Travel Hse has moved from fair to attractive, indicating a positive shift in its perceived value. The company is currently considered undervalued. Key ratios include a PE ratio of 14.91, an EV to EBITDA of 8.21, and a PEG ratio of 0.76, all of which suggest that the stock is trading at a favorable valuation relative to its earnings growth potential.<BR><BR>When compared to peers, Intl. Travel Hse stands out favorably against I R C T C, which is deemed very expensive with a PE ratio of 48.77, and Thomas Cook (I), which is also attractive but has a significantly higher PE ratio of 30.89. This peer comparison reinforces the attractiveness of Intl. Travel Hse's valuation. Additionally, despite recent underperformance against the Sensex over the past year, the company's strong historical returns over three and five years highlight its potential for future growth.

View full answer

What is the technical trend for Intl. Travel Hse?

09-Jun-2025

As of April 15, 2025, Intl. Travel Hse shows a mildly bearish trend overall, with mixed signals from indicators like the weekly MACD being mildly bullish and the monthly MACD being mildly bearish, while daily moving averages also align with the bearish outlook.

As of 15 April 2025, the technical trend for Intl. Travel Hse has changed from bearish to mildly bearish. The weekly MACD indicates a mildly bullish stance, while the monthly MACD is mildly bearish, suggesting mixed signals. The RSI shows no signal on the weekly chart but is bullish on the monthly, indicating potential upward momentum over a longer time frame. Bollinger Bands are mildly bullish weekly but bearish monthly, reflecting volatility concerns. Daily moving averages are mildly bearish, aligning with the overall trend. KST is mildly bullish weekly but mildly bearish monthly, further contributing to the mixed outlook. Dow Theory shows no trend in both weekly and monthly perspectives. Overall, the current technical stance is mildly bearish, with key indicators like the daily moving averages and monthly MACD influencing this view.

View full answer

Has Intl. Travel Hse declared dividend?

06-Jun-2025

International Travel House Ltd has declared a 50% dividend, amounting to ₹5 per share, with an ex-date of August 9, 2024. While recent total returns have shown volatility, longer-term performance indicates strong growth, with a total return of 933.6% over the past 5 years.

International Travel House Ltd has declared a 50% dividend.<BR><BR>Dividend Details:<BR>- Percentage announced: 50%<BR>- Amount per share: 5<BR>- Ex-date: 09 Aug 24<BR><BR>Dividend Yield: 0.99%.<BR><BR>Total Returns by Period:<BR>In the last 6 months, the price return was -27.12%, with a dividend return of 0%, resulting in a total return of -27.12%.<BR><BR>Over the past year, the price return was -15.83%, while the dividend return was 0.84%, leading to a total return of -14.99%.<BR><BR>In the 2-year period, the price return stood at 66.86%, with a dividend return of 2.85%, culminating in a total return of 69.71%.<BR><BR>For the 3-year period, the price return was an impressive 372.83%, with a dividend return of 8.69%, resulting in a total return of 381.52%.<BR><BR>In the last 4 years, the price return reached 533.08%, while the dividend return was 9.64%, leading to a total return of 542.72%.<BR><BR>Over the past 5 years, the price return was a remarkable 918.0%, with a dividend return of 15.60%, resulting in a total return of 933.6%.<BR><BR>Overall, while the recent dividend declaration indicates a positive step for shareholders, the total returns over shorter periods have shown significant volatility, particularly in the last 6 months and 1 year. However, the longer-term returns reflect strong growth, suggesting a potentially favorable investment in the long run.

View full answer
iScoreScore
Click here to find our call on this stock
Strong Sell
Sell
Hold
Buy
Strong Buy

Dashboard

1

The company has declared Negative results for the last 3 consecutive quarters

  • PAT(Latest six months) At Rs 10.87 cr has Grown at -25.03%
  • ROCE(HY) Lowest at 17.25%
  • NET SALES(Q) Lowest at Rs 55.27 cr
2

Below par performance in long term as well as near term

stock-summaryMojo Parameters

Mojo Parameters

Loading Valuation Snapshot...

Stock DNA

stock-summary
Industry

Tour, Travel Related Services

stock-summary
Market cap

INR 252 Cr (Micro Cap)

stock-summary
P/E

11.00

stock-summary
Industry P/E

36

stock-summary
Dividend Yield

1.73%

stock-summary
Debt Equity

-0.68

stock-summary
Return on Equity

12.90%

stock-summary
Price to Book

1.42

Revenue and Profits:
Net Sales:
55 Cr
(Quarterly Results - Jun 2026)
Net Profit:
6 Cr
stock-summaryTotal Returns
Total Returns (Price + Dividend) stock-summary
Dividend Yield (1.73%)
TimePeriod
Price Return
Dividend Return
Total Return
3 Months
-8.23%
1.65%
-6.58%
6 Months
-9.05%
1.64%
-7.41%
1 Year
-36.94%
2.31%
-34.63%
2 Years
-49.34%
2.59%
-46.75%
3 Years
-0.47%
5.91%
5.44%
4 Years
131.24%
13.91%
145.15%
5 Years
291.54%
26.85%
318.39%

Latest dividend: 5.499411764705882 per share ex-dividend date: Aug-01-2025

Risk Adjusted Returns v/s stock-summary
Returns Beta
Icon
Beta has not been calculated since enough price history is not available
stock-summaryNews & Corporate Actions

News

Announcements stock-summary

Intimation Of The Date Of Annual General Meeting

10-Jul-2026 | Source : BSE

Annual General Meeting

Board Meeting Outcome for Outcome Of Board Meeting Dated 10.07.2026

10-Jul-2026 | Source : BSE

Unaudited Financial Results for the Quarter ended 30th June 2026

Corporate Action - Fixed Record Date For Payment Of Dividend

10-Jul-2026 | Source : BSE

Record date - 31st July 2026.

Corporate Actions stock-summary

stock-summary
BOARD MEETING

No Upcoming Board Meetings

stock-summary
DIVIDEND

International Travel House Ltd has declared 55% dividend, ex-date: 31 Jul 26

stock-summary
SPLITS

No Splits history available

stock-summary
BONUS

No Bonus history available

stock-summary
RIGHTS

No Rights history available

stock-summaryKey Factors

Quality key factors stock-summary

Factor
Value
Sales Growth (5y)
29.94%
EBIT Growth (5y)
20.96%
EBIT to Interest (avg)
19.70
Debt to EBITDA (avg)
Net Debt is too low
Net Debt to Equity (avg)
-0.68
Sales to Capital Employed (avg)
1.32
Tax Ratio
26.18%
Dividend Payout Ratio
16.19%
Pledged Shares
0
Institutional Holding
0.01%
ROCE (avg)
18.38%
ROE (avg)
13.77%

Valuation key factors

Factor
Value
P/E Ratio
11
Industry P/E
36
Price to Book Value
1.39
EV to EBIT
5.47
EV to EBITDA
3.94
EV to Capital Employed
2.24
EV to Sales
0.55
PEG Ratio
NA
Dividend Yield
1.76%
ROCE (Latest)
44.13%
ROE (Latest)
12.90%

Technicals key factors

Indicator
Weekly
Monthly
MACD
Mildly Bullish
Bearish
RSI
No Signal
No Signal
Bollinger Bands
Bearish
Mildly Bearish
Moving Averages
Bearish (Daily)
KST
Mildly Bullish
Bearish
Dow Theory
Mildly Bearish
Mildly Bearish
stock-summary Technical Indicator Scale: Bearish, Mildly Bearish, Sideways, Mildly Bullish, Bullish  Turned 
stock-summaryShareholding
Shareholding Snapshot : Mar 2026stock-summary
Shareholding Compare (%holding) stock-summary
Majority shareholders

Promoters

Pledged Promoter Holdings

None

Mutual Funds

Held by 0 Schemes

FIIs

Held by 0 FIIs

Promoter with highest holding

Itc Hotels Limited (48.96%)

Highest Public shareholder

Vaibhav Doshi (3.14%)

Individual Investors Holdings

32.46%

stock-summaryFinancial
[
  {
    "link": "quarterly",
    "btn_text": "All Quarterly Results",
    "header": "Quarterly Results Snapshot (Standalone) - Jun'26 - QoQ",
    "rhs": [
      {
        "prefix": "Net Sales ",
        "suffix": "QoQ Growth in quarter ended Jun 2026 is -3.09% vs -2.04% in Mar 2026",
        "dir": -1
      },
      {
        "prefix": "Standalone Net Profit ",
        "suffix": "QoQ Growth in quarter ended Jun 2026 is 7.84% vs 26,250.00% in Mar 2026",
        "dir": -1
      }
    ],
    "table": {
      "header": [
        "Jun'26",
        "Mar'26",
        "Change(%)"
      ],
      "body": [
        {
          "field": "Net Sales",
          "val1": "55.27",
          "val2": "57.03",
          "chgp": "-3.09%",
          "chgp_class": "negative"
        },
        {
          "field": "Operating Profit (PBDIT) excl Other Income",
          "val1": "7.78",
          "val2": "8.12",
          "chgp": "-4.19%",
          "chgp_class": "negative"
        },
        {
          "field": "Interest",
          "val1": "0.02",
          "val2": "0.03",
          "chgp": "-33.33%",
          "chgp_class": "positive"
        },
        {
          "field": "Exceptional Items",
          "val1": "0.00",
          "val2": "0.00",
          "chgp": "",
          "chgp_class": "neutral"
        },
        {
          "field": "Standalone Net Profit",
          "val1": "5.64",
          "val2": "5.23",
          "chgp": "7.84%",
          "chgp_class": "positive"
        },
        {
          "field": "Operating Profit Margin (Excl OI)",
          "val1": "14.08%",
          "val2": "14.24%",
          "chgp": "-0.16%",
          "chgp_class": "negative"
        }
      ]
    }
  },
  {
    "link": "half-yearly",
    "btn_text": "All Half Yearly Results",
    "header": "Half Yearly Results Snapshot (Standalone) - Sep'25",
    "rhs": [
      {
        "prefix": "Net Sales ",
        "suffix": " Growth in half year ended Sep 2025 is -0.27% vs 11.17% in Sep 2024",
        "dir": -1
      },
      {
        "prefix": "Standalone Net Profit ",
        "suffix": " Growth in half year ended Sep 2025 is -6.22% vs 23.60% in Sep 2024",
        "dir": -1
      }
    ],
    "table": {
      "header": [
        "Sep'25",
        "Sep'24",
        "Change(%)"
      ],
      "body": [
        {
          "field": "Net Sales",
          "val1": "116.38",
          "val2": "116.69",
          "chgp": "-0.27%",
          "chgp_class": "negative"
        },
        {
          "field": "Operating Profit (PBDIT) excl Other Income",
          "val1": "18.74",
          "val2": "19.68",
          "chgp": "-4.78%",
          "chgp_class": "negative"
        },
        {
          "field": "Interest",
          "val1": "0.06",
          "val2": "0.06",
          "chgp": "",
          "chgp_class": "neutral"
        },
        {
          "field": "Exceptional Items",
          "val1": "0.00",
          "val2": "0.00",
          "chgp": "",
          "chgp_class": "neutral"
        },
        {
          "field": "Standalone Net Profit",
          "val1": "13.26",
          "val2": "14.14",
          "chgp": "-6.22%",
          "chgp_class": "negative"
        },
        {
          "field": "Operating Profit Margin (Excl OI)",
          "val1": "16.10%",
          "val2": "16.87%",
          "chgp": "-0.77%",
          "chgp_class": "negative"
        }
      ]
    }
  },
  {
    "link": "nine-monthly",
    "btn_text": "All Nine Monthly Results",
    "header": "Nine Monthly Results Snapshot (Standalone) - Dec'25",
    "rhs": [
      {
        "prefix": "Net Sales ",
        "suffix": "YoY Growth in nine months ended Dec 2025 is -0.21% vs 10.27% in Dec 2024",
        "dir": -1
      },
      {
        "prefix": "Standalone Net Profit ",
        "suffix": "YoY Growth in nine months ended Dec 2025 is -32.17% vs 19.17% in Dec 2024",
        "dir": -1
      }
    ],
    "table": {
      "header": [
        "Dec'25",
        "Dec'24",
        "Change(%)"
      ],
      "body": [
        {
          "field": "Net Sales",
          "val1": "174.60",
          "val2": "174.96",
          "chgp": "-0.21%",
          "chgp_class": "negative"
        },
        {
          "field": "Operating Profit (PBDIT) excl Other Income",
          "val1": "25.81",
          "val2": "27.24",
          "chgp": "-5.25%",
          "chgp_class": "negative"
        },
        {
          "field": "Interest",
          "val1": "0.09",
          "val2": "0.10",
          "chgp": "-10.00%",
          "chgp_class": "positive"
        },
        {
          "field": "Exceptional Items",
          "val1": "-5.89",
          "val2": "0.00",
          "chgp": "",
          "chgp_class": "neutral"
        },
        {
          "field": "Standalone Net Profit",
          "val1": "13.24",
          "val2": "19.52",
          "chgp": "-32.17%",
          "chgp_class": "negative"
        },
        {
          "field": "Operating Profit Margin (Excl OI)",
          "val1": "14.78%",
          "val2": "15.57%",
          "chgp": "-0.79%",
          "chgp_class": "negative"
        }
      ]
    }
  },
  {
    "link": "annual",
    "btn_text": "All Annual Results",
    "header": "Annual Results Snapshot (Standalone) - Mar'26",
    "rhs": [
      {
        "prefix": "Net Sales ",
        "suffix": "YoY Growth in year ended Mar 2026 is -1.70% vs 8.42% in Mar 2025",
        "dir": -1
      },
      {
        "prefix": "Standalone Net Profit ",
        "suffix": "YoY Growth in year ended Mar 2026 is -31.93% vs 20.67% in Mar 2025",
        "dir": -1
      }
    ],
    "table": {
      "header": [
        "Mar'26",
        "Mar'25",
        "Change(%)"
      ],
      "body": [
        {
          "field": "Net Sales",
          "val1": "231.63",
          "val2": "235.63",
          "chgp": "-1.70%",
          "chgp_class": "negative"
        },
        {
          "field": "Operating Profit (PBDIT) excl Other Income",
          "val1": "33.93",
          "val2": "37.51",
          "chgp": "-9.54%",
          "chgp_class": "negative"
        },
        {
          "field": "Interest",
          "val1": "0.12",
          "val2": "0.13",
          "chgp": "-7.69%",
          "chgp_class": "positive"
        },
        {
          "field": "Exceptional Items",
          "val1": "-5.89",
          "val2": "0.00",
          "chgp": "",
          "chgp_class": "neutral"
        },
        {
          "field": "Standalone Net Profit",
          "val1": "18.48",
          "val2": "27.15",
          "chgp": "-31.93%",
          "chgp_class": "negative"
        },
        {
          "field": "Operating Profit Margin (Excl OI)",
          "val1": "14.65%",
          "val2": "15.92%",
          "chgp": "-1.27%",
          "chgp_class": "negative"
        }
      ]
    }
  }
]

Quarterly Results Snapshot (Standalone) - Jun'26 - QoQstock-summary

Jun'26
Mar'26
Change(%)
Net Sales
55.27
57.03
-3.09%
Operating Profit (PBDIT) excl Other Income
7.78
8.12
-4.19%
Interest
0.02
0.03
-33.33%
Exceptional Items
0.00
0.00
Standalone Net Profit
5.64
5.23
7.84%
Operating Profit Margin (Excl OI)
14.08%
14.24%
-0.16%
Values in Rs Cr.
Direction Arrows
Net Sales

QoQ Growth in quarter ended Jun 2026 is -3.09% vs -2.04% in Mar 2026

Direction Arrows
Standalone Net Profit

QoQ Growth in quarter ended Jun 2026 is 7.84% vs 26,250.00% in Mar 2026

Half Yearly Results Snapshot (Standalone) - Sep'25stock-summary

Sep'25
Sep'24
Change(%)
Net Sales
116.38
116.69
-0.27%
Operating Profit (PBDIT) excl Other Income
18.74
19.68
-4.78%
Interest
0.06
0.06
Exceptional Items
0.00
0.00
Standalone Net Profit
13.26
14.14
-6.22%
Operating Profit Margin (Excl OI)
16.10%
16.87%
-0.77%
Values in Rs Cr.
Direction Arrows
Net Sales

Growth in half year ended Sep 2025 is -0.27% vs 11.17% in Sep 2024

Direction Arrows
Standalone Net Profit

Growth in half year ended Sep 2025 is -6.22% vs 23.60% in Sep 2024

Nine Monthly Results Snapshot (Standalone) - Dec'25stock-summary

Dec'25
Dec'24
Change(%)
Net Sales
174.60
174.96
-0.21%
Operating Profit (PBDIT) excl Other Income
25.81
27.24
-5.25%
Interest
0.09
0.10
-10.00%
Exceptional Items
-5.89
0.00
Standalone Net Profit
13.24
19.52
-32.17%
Operating Profit Margin (Excl OI)
14.78%
15.57%
-0.79%
Values in Rs Cr.
Direction Arrows
Net Sales

YoY Growth in nine months ended Dec 2025 is -0.21% vs 10.27% in Dec 2024

Direction Arrows
Standalone Net Profit

YoY Growth in nine months ended Dec 2025 is -32.17% vs 19.17% in Dec 2024

Annual Results Snapshot (Standalone) - Mar'26stock-summary

Mar'26
Mar'25
Change(%)
Net Sales
231.63
235.63
-1.70%
Operating Profit (PBDIT) excl Other Income
33.93
37.51
-9.54%
Interest
0.12
0.13
-7.69%
Exceptional Items
-5.89
0.00
Standalone Net Profit
18.48
27.15
-31.93%
Operating Profit Margin (Excl OI)
14.65%
15.92%
-1.27%
Values in Rs Cr.
Direction Arrows
Net Sales

YoY Growth in year ended Mar 2026 is -1.70% vs 8.42% in Mar 2025

Direction Arrows
Standalone Net Profit

YoY Growth in year ended Mar 2026 is -31.93% vs 20.67% in Mar 2025

stock-summaryCompany CV
About International Travel House Ltd stock-summary
stock-summary
International Travel House Ltd
Micro Cap
Tour, Travel Related Services
International Travel House Limited, a part of ITC Group of Hotels was originally incorporated as Indian Exploration Pvt Ltd on 29th June, 1981, which acquired its present name in 1992. The Company is one of the India's leading travel management company and is engaged in the business of providing travel related services to travellers in India and abroad. The Company offers a range of services related to travel and tourism with offices in all the Indian metros plus Ahmedabad and Pune.
Company Coordinates stock-summary
Company Details
Travel House T2 Community Cent, Sheikh Sarai Phase I New Delhi New Delhi : 110017
stock-summary
Tel: 91-11-26017808
stock-summary
travelhouse@ith.co.in
Registrar Details
MCS Ltd , F-65, , Okhla Industrial Area, Phase - I, New Delhi