
Compare IOL Chemicals with Similar Stocks
Stock DNA
Pharmaceuticals & Biotechnology
INR 3,957 Cr (Small Cap)
26.00
42
0.75%
-0.04
8.12%
2.17
Total Returns (Price + Dividend) 
Latest dividend: 1 per share ex-dividend date: Feb-17-2026
Risk Adjusted Returns v/s
Returns Beta

News
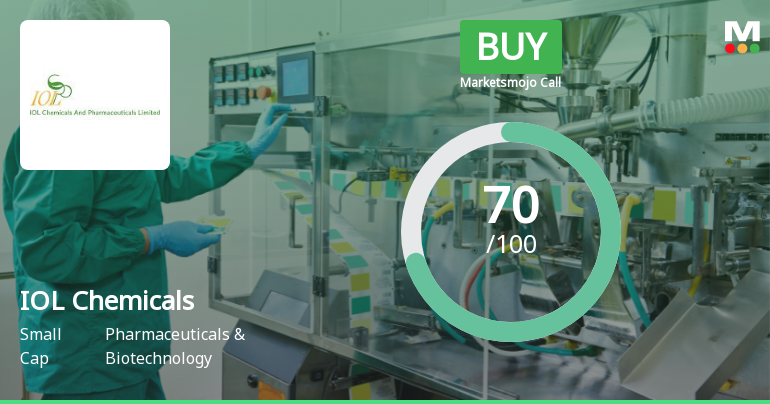
IOL Chemicals & Pharmaceuticals Ltd Upgraded to Buy on Strong Financial and Technical Performance
IOL Chemicals & Pharmaceuticals Ltd has been upgraded from a Hold to a Buy rating, reflecting significant improvements across technical indicators, financial trends, valuation metrics, and overall quality. This upgrade, announced on 8 June 2026, follows a period of robust earnings growth, enhanced promoter confidence, and a bullish technical outlook, positioning the stock favourably within the Pharmaceuticals & Biotechnology sector.
Read full news article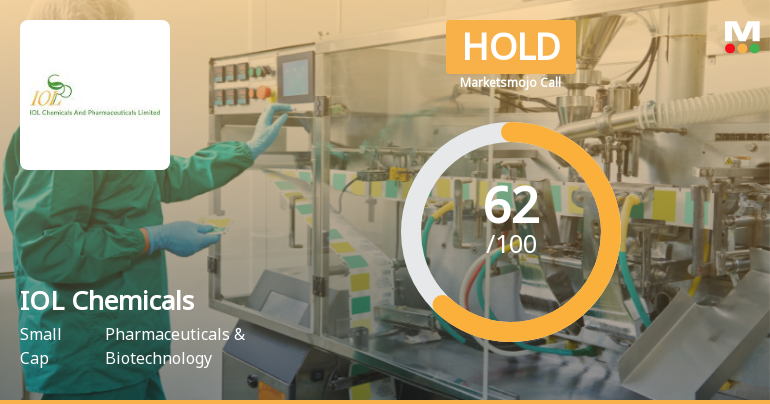
IOL Chemicals & Pharmaceuticals Ltd Downgraded to Hold Amid Mixed Technical and Valuation Signals
IOL Chemicals & Pharmaceuticals Ltd has seen its investment rating downgraded from Buy to Hold as of 1 June 2026, reflecting a nuanced reassessment across quality, valuation, financial trends, and technical indicators. Despite robust quarterly earnings and strong promoter confidence, concerns over valuation premiums and mixed technical signals have tempered enthusiasm among analysts.
Read full news article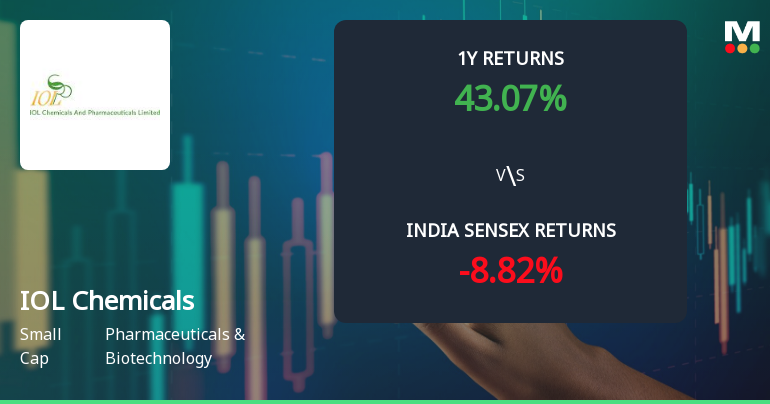
IOL Chemicals & Pharmaceuticals Ltd: Technical Momentum Shifts Amid Mixed Indicator Signals
IOL Chemicals & Pharmaceuticals Ltd has experienced a nuanced shift in its technical momentum, transitioning from a bullish to a mildly bullish trend. Despite a recent downgrade in its Mojo Grade from Buy to Hold, the stock continues to demonstrate resilience with mixed signals from key technical indicators such as MACD, RSI, and moving averages, reflecting a complex market sentiment in the Pharmaceuticals & Biotechnology sector.
Read full news article Announcements
Announcement under Regulation 30 (LODR)-Earnings Call Transcript
28-May-2026 | Source : BSEEarning call transcript
Announcement under Regulation 30 (LODR)-Analyst / Investor Meet - Intimation
22-May-2026 | Source : BSESchedule of Analyst/Investor Meeting
Announcement under Regulation 30 (LODR)-Analyst / Investor Meet - Outcome
22-May-2026 | Source : BSEAudio Recording of Analysts/Investors Call pertaining to the Financial Results Q4 FY2026
Corporate Actions

No Upcoming Board Meetings

IOL Chemicals & Pharmaceuticals Ltd has declared 50% dividend, ex-date: 17 Feb 26

IOL Chemicals & Pharmaceuticals Ltd has announced 2:10 stock split, ex-date: 11 Mar 25

No Bonus history available

No Rights history available
Quality key factors
Valuation key factors
Technicals key factors
 Technical Indicator Scale: Bearish, Mildly Bearish, Sideways, Mildly Bullish, Bullish Turned
 Shareholding Snapshot : Mar 2026
Shareholding Compare (%holding)
Promoters
None
Held by 6 Schemes (0.02%)
Held by 53 FIIs (1.72%)
Maya Devi Polycot Limited (21.79%)
Synthorix Trading Limited (3.81%)
31.03%
Quarterly Results Snapshot (Consolidated) - Mar'26 - QoQ

QoQ Growth in quarter ended Mar 2026 is 6.73% vs 2.27% in Dec 2025
QoQ Growth in quarter ended Mar 2026 is 158.31% vs -31.33% in Dec 2025
Half Yearly Results Snapshot (Consolidated) - Sep'25
Growth in half year ended Sep 2025 is 8.86% vs -7.25% in Sep 2024
Growth in half year ended Sep 2025 is 30.09% vs -41.34% in Sep 2024
Nine Monthly Results Snapshot (Consolidated) - Dec'25
YoY Growth in nine months ended Dec 2025 is 9.55% vs -4.75% in Dec 2024
YoY Growth in nine months ended Dec 2025 is 21.29% vs -34.79% in Dec 2024
Annual Results Snapshot (Consolidated) - Mar'26
YoY Growth in year ended Mar 2026 is 11.54% vs -2.51% in Mar 2025
YoY Growth in year ended Mar 2026 is 36.18% vs -24.82% in Mar 2025
About IOL Chemicals & Pharmaceuticals Ltd

Company Coordinates


