
Historical numbers are not comparable for this company due to transfer of 9 assets by IRB to Private InvIT in FY20.
Pledge shareholding: IRB has provided a non-disposal undertaking (committing not to sell a certain percentage of their holding in IRB) to GIC and the Ferrovial Group.
Compare IRB Infra.Devl. with Similar Stocks
Dashboard
Weak Long Term Fundamental Strength with an average Return on Capital Employed (ROCE) of 7.69%
- Poor long term growth as Net Sales has grown by an annual rate of 7.62% and Operating profit at 8.02% over the last 5 years
- Low ability to service debt as the company has a high Debt to EBITDA ratio of 5.03 times
With ROCE of 7.3, it has a Expensive valuation with a 1.1 Enterprise value to Capital Employed
Underperformed the market in the last 1 year
Stock DNA
Construction
INR 23,890 Cr (Small Cap)
25.00
42
0.78%
0.86
4.20%
1.15
Total Returns (Price + Dividend) 
Latest dividend: 0.049999999999999996 per share ex-dividend date: May-26-2026
Risk Adjusted Returns v/s
Returns Beta

News
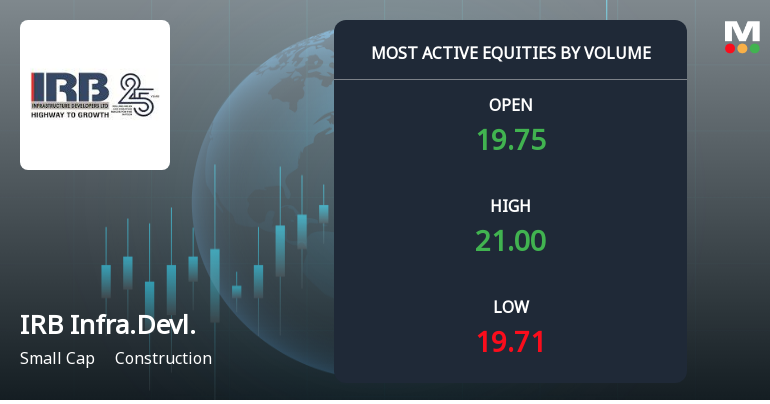
IRB Infrastructure Sees Exceptional Volume Surge Amid Mixed Technical Signals
IRB Infrastructure Developers Ltd witnessed a remarkable surge in trading volume on 30 Jul 2026, emerging as one of the most actively traded stocks in the construction sector. Despite a modest price gain, the stock’s technical indicators and market sentiment present a complex picture for investors navigating this small-cap player.
Read full news article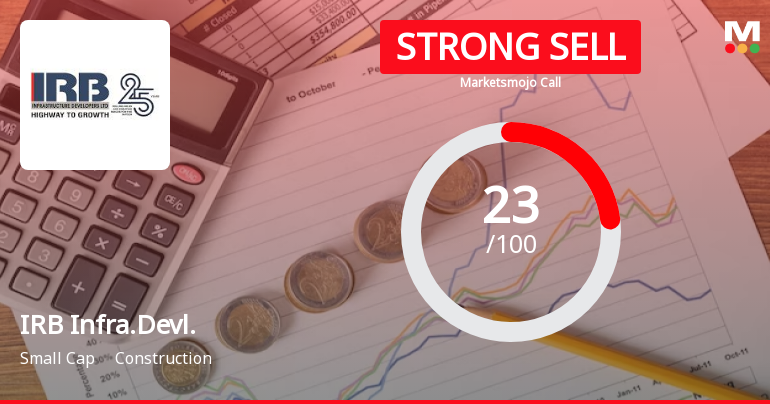
IRB Infrastructure Developers Ltd is Rated Strong Sell
IRB Infrastructure Developers Ltd is rated Strong Sell by MarketsMOJO, with this rating last updated on 06 July 2026. However, the analysis and financial metrics presented here reflect the stock’s current position as of 29 July 2026, providing investors with the most up-to-date view of the company’s fundamentals, valuation, financial trends, and technical outlook.
Read full news article Announcements
Board Meeting Intimation for Intimation Of Board Meeting
27-Jul-2026 | Source : BSEIRB Infrastructure Developers Ltdhas informed BSE that the meeting of the Board of Directors of the Company is scheduled on 30/07/2026 inter alia to consider and approve Consolidated & Standalone Unaudited Financial Results for the quarter ended June 30 2026 and Declaration of Interim Dividend for financial year 2026-27 if any.
Corporate Action-Board to consider Dividend
27-Jul-2026 | Source : BSERecord date for the purpose of Interim Dividend if declared by the Board of Directors of the Company is August 05 2026.
Announcement under Regulation 30 (LODR)-Analyst / Investor Meet - Intimation
27-Jul-2026 | Source : BSEThe Company will conduct earnings call at 04:00 p.m. IST on July 30 2026.
Corporate Actions

(30 Jul 2026)

IRB Infrastructure Developers Ltd has declared 5% dividend, ex-date: 26 May 26

IRB Infrastructure Developers Ltd has announced 1:10 stock split, ex-date: 22 Feb 23

IRB Infrastructure Developers Ltd has announced 1:1 bonus issue, ex-date: 30 Mar 26

No Rights history available
Quality key factors
Valuation key factors
Technicals key factors
 Technical Indicator Scale: Bearish, Mildly Bearish, Sideways, Mildly Bullish, Bullish Turned
 Shareholding Snapshot : Jun 2026
Shareholding Compare (%holding)
FIIs
0.0346
Held by 19 Schemes (4.72%)
Held by 159 FIIs (43.87%)
Irb Holding Private Limited (29.94%)
Lici Ulip-growth Fund (5.13%)
13.6%
Quarterly Results Snapshot (Consolidated) - Jun'26 - QoQ

QoQ Growth in quarter ended Jun 2026 is 10.91% vs 2.98% in Mar 2026

QoQ Growth in quarter ended Jun 2026 is 3.38% vs 40.55% in Mar 2026
Half Yearly Results Snapshot (Consolidated) - Sep'25
Growth in half year ended Sep 2025 is 11.96% vs 1.76% in Sep 2024
Growth in half year ended Sep 2025 is 43.14% vs 4.50% in Sep 2024
Nine Monthly Results Snapshot (Consolidated) - Dec'25
YoY Growth in nine months ended Dec 2025 is 4.70% vs 2.18% in Dec 2024
YoY Growth in nine months ended Dec 2025 is -91.16% vs 1,402.84% in Dec 2024
Annual Results Snapshot (Consolidated) - Mar'26
YoY Growth in year ended Mar 2026 is 0.46% vs 2.76% in Mar 2025
YoY Growth in year ended Mar 2026 is -86.88% vs 969.74% in Mar 2025
About IRB Infrastructure Developers Ltd

Company Coordinates


