
Compare IRIS Regtech Sol with Similar Stocks
Dashboard
The company is Net-Debt Free
Poor long term growth as Operating profit has grown by an annual rate 3.75% of over the last 5 years
The company has declared Positive results for the last 3 consecutive quarters
With ROE of 14, it has a Very Expensive valuation with a 2.8 Price to Book Value
Despite the size of the company, domestic mutual funds hold only 0% of the company
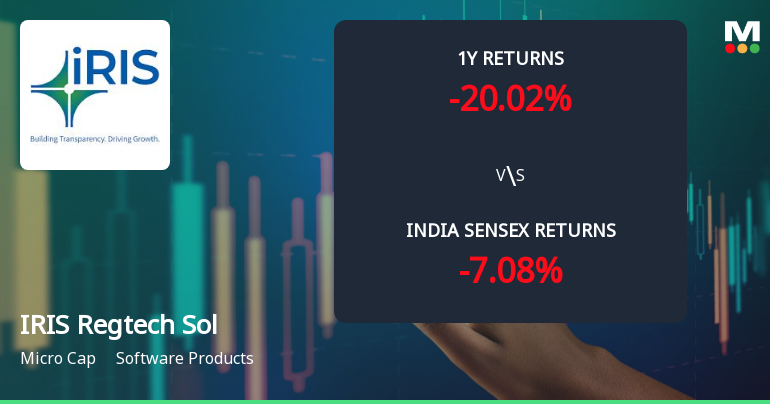
Underperformed the market in the last 1 year
Stock DNA
Software Products
INR 556 Cr (Micro Cap)
20.00
22
0.00%
-0.52
14.00%
2.73
Total Returns (Price + Dividend) 
IRIS Regtech Sol for the last several years.
Risk Adjusted Returns v/s
Returns Beta

News
IRIS Regtech Solutions Ltd Technical Momentum Shifts Amid Mixed Market Signals
IRIS Regtech Solutions Ltd has exhibited a notable shift in its technical momentum, moving from a mildly bearish stance to a sideways trend, reflecting a complex interplay of bullish and bearish signals across key technical indicators. Despite a modest day gain of 1.04%, the stock remains under pressure with a Mojo Grade of Sell, upgraded from Strong Sell as of 28 July 2025, underscoring cautious optimism amid mixed market dynamics.
Read full news article
IRIS Regtech Solutions Ltd is Rated Sell
IRIS Regtech Solutions Ltd is rated 'Sell' by MarketsMOJO, with this rating last updated on 18 Nov 2025. However, the analysis and financial metrics discussed here reflect the stock’s current position as of 02 July 2026, providing investors with an up-to-date view of the company’s fundamentals, valuation, financial trends, and technical outlook.
Read full news article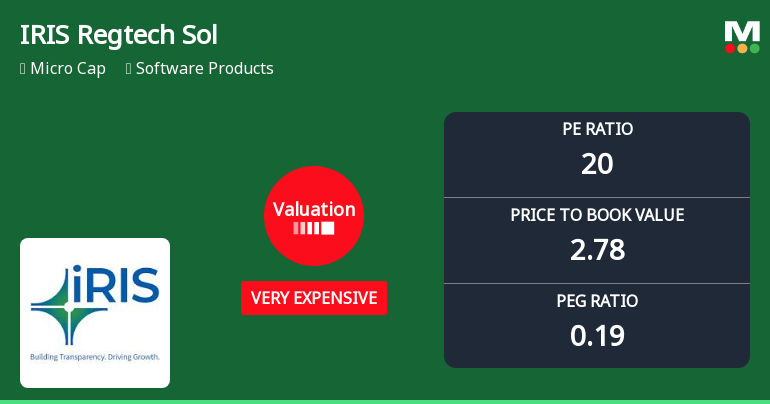
IRIS Regtech Solutions Ltd Valuation Shifts Signal Heightened Price Risk
IRIS Regtech Solutions Ltd has seen a marked shift in its valuation parameters, moving from an expensive to a very expensive rating, despite recent strong price gains. This change raises questions about the stock’s price attractiveness relative to its historical averages and peer group, especially amid a micro-cap classification and a recent upgrade in its Mojo Grade from Strong Sell to Sell.
Read full news article Announcements
Closure of Trading Window
26-Jun-2026 | Source : BSEWe hereby submit intimation of Closure of Trading Window.
Announcement under Regulation 30 (LODR)-Analyst / Investor Meet - Intimation
24-Jun-2026 | Source : BSEWe hereby submit intimation of Investor Meeting.
Announcement under Regulation 30 (LODR)-Change in Registered Office Address
28-May-2026 | Source : BSEWe hereby submit the intimation of change in the registered office of the company.
Corporate Actions

No Upcoming Board Meetings

No Dividend history available

No Splits history available

No Bonus history available

No Rights history available
Quality key factors
Valuation key factors
Technicals key factors
 Technical Indicator Scale: Bearish, Mildly Bearish, Sideways, Mildly Bullish, Bullish Turned
 Shareholding Snapshot : Mar 2026
Shareholding Compare (%holding)
Non Institution
None
Held by 0 Schemes
Held by 4 FIIs (1.87%)
Deepta Rangarajan (28.77%)
Subhkam Ventures I Private Limited (7.77%)
35.83%
Quarterly Results Snapshot (Consolidated) - Mar'26 - YoY

YoY Growth in quarter ended Mar 2026 is 31.64% vs -2.01% in Mar 2025
YoY Growth in quarter ended Mar 2026 is 47.16% vs -40.13% in Mar 2025
Half Yearly Results Snapshot (Consolidated) - Sep'25

Growth in half year ended Sep 2025 is 5.25% vs 14.53% in Sep 2024
Growth in half year ended Sep 2025 is 1,654.57% vs 196.44% in Sep 2024
Nine Monthly Results Snapshot (Consolidated) - Dec'25
YoY Growth in nine months ended Dec 2025 is 6.48% vs 16.64% in Dec 2024
YoY Growth in nine months ended Dec 2025 is 1,098.24% vs 156.53% in Dec 2024
Annual Results Snapshot (Consolidated) - Mar'26
YoY Growth in year ended Mar 2026 is 17.16% vs 7.21% in Mar 2025
YoY Growth in year ended Mar 2026 is 870.76% vs 49.94% in Mar 2025
About IRIS Regtech Solutions Ltd

Company Coordinates


