
Compare Ishita Drugs with Similar Stocks
Dashboard
Weak Long Term Fundamental Strength with a -2.09% CAGR growth in Operating Profits over the last 5 years
- Company's ability to service its debt is weak with a poor EBIT to Interest (avg) ratio of 0.79
- The company has been able to generate a Return on Equity (avg) of 8.40% signifying low profitability per unit of shareholders funds
Negative results in Mar 26
Stock DNA
Pharmaceuticals & Biotechnology
INR 23 Cr (Micro Cap)
28.00
27
0.00%
-0.41
7.23%
2.08
Total Returns (Price + Dividend) 
Ishita Drugs for the last several years.
Risk Adjusted Returns v/s
Returns Beta

News

Ishita Drugs & Industries Ltd Valuation Shifts Signal Renewed Price Attractiveness
Ishita Drugs & Industries Ltd has witnessed a notable shift in its valuation parameters, moving from a fair to an attractive rating, despite ongoing market headwinds and a recent downgrade in its overall mojo grade to Strong Sell. This recalibration in price-to-earnings and price-to-book value metrics invites a closer examination of the stock’s price attractiveness relative to its historical averages and peer group within the Pharmaceuticals & Biotechnology sector.
Read full news article
Ishita Drugs & Industries Ltd Downgraded to Strong Sell Amid Valuation and Financial Concerns
Ishita Drugs & Industries Ltd has been downgraded from a Sell to a Strong Sell rating as of 8 June 2026, reflecting deteriorating fundamentals and valuation pressures. The pharmaceutical company’s Mojo Score has dropped to 23.0, signalling heightened risk for investors amid weak financial trends, stretched valuation metrics, and unfavourable technical indicators.
Read full news article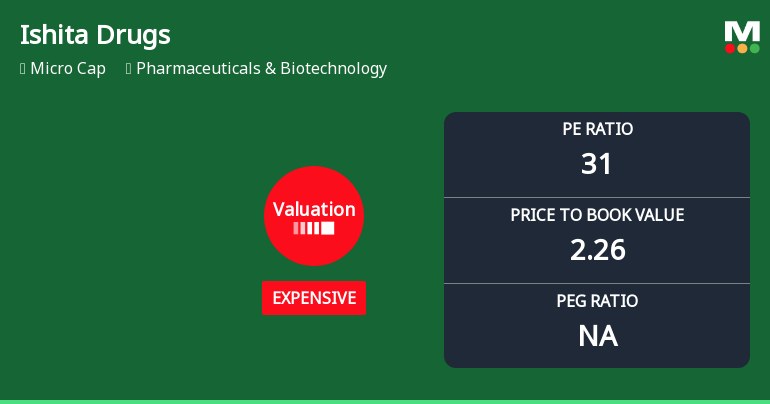
Ishita Drugs & Industries Ltd: Valuation Shift Signals Price Attractiveness Change
Ishita Drugs & Industries Ltd has witnessed a notable shift in its valuation parameters, moving from a fair to an expensive rating, reflecting a change in price attractiveness relative to its historical averages and peer group within the Pharmaceuticals & Biotechnology sector. This article analyses the implications of these valuation changes, comparing key metrics such as price-to-earnings (P/E) and price-to-book value (P/BV) ratios against industry benchmarks and historical trends, providing investors with a comprehensive view of the stock’s current standing.
Read full news article Announcements
Outcome Of Board Meeting Held On 30Th May 2026
30-May-2026 | Source : BSEAudited Financial Results for the quarter and year ended 31st March 2026
Board Meeting Outcome for Outcome Of Board Meeting Held On 30Th May 2026
30-May-2026 | Source : BSEOutcome of Board Meeting held on 30th May 2026
Board Meeting Intimation for Intimation Of Board Meeting Pursuant To Regulation 29 Of The SEBI (LODR) Regulations 2015 For The Quarter And Year Ended 31St March 2026
23-May-2026 | Source : BSEIshita Drugs & Industries Ltdhas informed BSE that the meeting of the Board of Directors of the Company is scheduled on 30/05/2026 inter alia to consider and approve 1. To consider approve and take on records the Audited Financial Results of the Company for the quarter and year ended 31st March 2026 pursuant to Regulation 33 of the SEBI (Listing Obligations and Disclosure Requirements) Regulations 2015. 2. To consider and approve the Directors Report with the Annexure Corporate Governance Report Management Discussion and Analysis Report and Notice for convening the 33rd Annual General Meeting of the Company. 3. To consider the re-appointment of Internal Auditors of the Company for the year 2026-27. 4. To take on record Disclosure of Interest of Directors. 5. Any other matter with permission of the Chair.
Corporate Actions

No Upcoming Board Meetings

No Dividend history available

No Splits history available

No Bonus history available

No Rights history available
Quality key factors
Valuation key factors
Technicals key factors
 Technical Indicator Scale: Bearish, Mildly Bearish, Sideways, Mildly Bullish, Bullish Turned
 Shareholding Snapshot : Mar 2026
Shareholding Compare (%holding)
Promoters
None
Held by 0 Schemes
Held by 0 FIIs
Umang Financial Services Limited (9.94%)
Mahendra Girdharilal Wadhwani (2.15%)
47.37%
Quarterly Results Snapshot (Standalone) - Mar'26 - QoQ

QoQ Growth in quarter ended Mar 2026 is -2.55% vs 2.28% in Dec 2025
QoQ Growth in quarter ended Mar 2026 is 12.50% vs 14.29% in Dec 2025
Half Yearly Results Snapshot (Standalone) - Sep'25

Growth in half year ended Sep 2025 is 34.44% vs -15.78% in Sep 2024
Growth in half year ended Sep 2025 is 32.35% vs -2.86% in Sep 2024
Nine Monthly Results Snapshot (Standalone) - Dec'25
YoY Growth in nine months ended Dec 2025 is 11.31% vs -2.43% in Dec 2024
YoY Growth in nine months ended Dec 2025 is 5.17% vs 23.40% in Dec 2024
Annual Results Snapshot (Standalone) - Mar'26
YoY Growth in year ended Mar 2026 is -2.27% vs -1.25% in Mar 2025
YoY Growth in year ended Mar 2026 is -10.34% vs 16.00% in Mar 2025
About Ishita Drugs & Industries Ltd

Company Coordinates


