
Compare Ivalue Infosolut with Similar Stocks
Stock DNA
Computers - Software & Consulting
INR 1,287 Cr (Micro Cap)
12.00
20
0.00%
-0.12
19.28%
2.54
Total Returns (Price + Dividend) 
Ivalue Infosolut for the last several years.
Risk Adjusted Returns v/s
Returns Beta

News

Ivalue Infosolutions Ltd is Rated Buy by MarketsMOJO
Ivalue Infosolutions Ltd is rated 'Buy' by MarketsMOJO, with this rating last updated on 01 June 2026. However, the analysis and financial metrics discussed here reflect the company’s current position as of 10 June 2026, providing investors with the latest insights into its performance and outlook.
Read full news article
Ivalue Infosolutions Ltd Technical Momentum Shifts Amid Mixed Market Returns
Ivalue Infosolutions Ltd, a micro-cap player in the Computers - Software & Consulting sector, has recently exhibited a subtle but noteworthy shift in its technical momentum. After a period of sideways movement, the stock’s technical indicators now suggest a mildly bullish trend, supported by mixed signals from MACD, RSI, and moving averages. Despite a recent dip in price, the evolving technical landscape offers investors a nuanced view of the stock’s near-term prospects.
Read full news article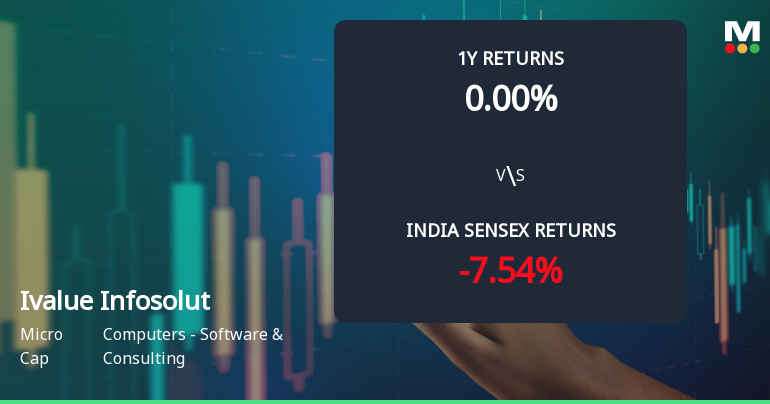
Ivalue Infosolutions Ltd Technical Momentum Shifts Amid Market Pressure
Ivalue Infosolutions Ltd, a micro-cap player in the Computers - Software & Consulting sector, has experienced a notable shift in its technical momentum, moving from a mildly bullish stance to a sideways trend. Despite a recent downgrade in its technical trend, the company retains a strong Mojo Grade of 71.0, upgraded from Hold to Buy as of 1 June 2026, signalling underlying strength amid short-term volatility.
Read full news article Announcements
Announcement under Regulation 30 (LODR)-Earnings Call Transcript
03-Jun-2026 | Source : BSETranscript of discussion on the Companys Audited Financial Results (Standalone and Consolidated) for the quarter and year ended March 31 2026 presented during the analyst meet held on May 27 2026.
Announcement under Regulation 30 (LODR)-Analyst / Investor Meet - Intimation
01-Jun-2026 | Source : BSEIntimation of Group Meeting / One-to-One Meeting with Analysts / Investors under Regulation 30 of the SEBI (Listing Obligations and Disclosure Requirements) Regulations 2015 scheduled on 4th June 2026 and 5th June 2026
Compliances-Reg.24(A)-Annual Secretarial Compliance
01-Jun-2026 | Source : BSEAnnual Secretarial Compliance Report for the year ended 31st March 2026 both PDF and XBRL was submitted on 27th May 2026
Corporate Actions

No Upcoming Board Meetings

No Dividend history available

No Splits history available

No Bonus history available

No Rights history available
Quality key factors
Valuation key factors
Technicals key factors
 Technical Indicator Scale: Bearish, Mildly Bearish, Sideways, Mildly Bullish, Bullish Turned
 Shareholding Snapshot : Mar 2026
Shareholding Compare (%holding)
Non Institution
None
Held by 2 Schemes (6.87%)
Held by 15 FIIs (2.22%)
Sunil Kumar Pillai (13.9%)
Sundara (mauritius) Limited (10.43%)
34.33%
Quarterly Results Snapshot (Standalone) - Mar'26 - QoQ

QoQ Growth in quarter ended Mar 2026 is 21.01% vs -33.24% in Dec 2025
QoQ Growth in quarter ended Mar 2026 is 173.23% vs -45.59% in Dec 2025
Half Yearly Results Snapshot (Standalone) - Sep'25
Not Applicable: The company has declared_date for only one period
Not Applicable: The company has declared_date for only one period
Nine Monthly Results Snapshot (Standalone) - Dec'25
Not Applicable: The company has declared_date for only one period
Not Applicable: The company has declared_date for only one period
Annual Results Snapshot (Consolidated) - Mar'26

YoY Growth in year ended Mar 2026 is 14.40% vs 18.26% in Mar 2025
YoY Growth in year ended Mar 2026 is 14.78% vs 20.48% in Mar 2025
About Ivalue Infosolutions Ltd

Company Coordinates


