
Compare Jai Balaji Inds. with Similar Stocks
Stock DNA
Ferrous Metals
INR 6,269 Cr (Small Cap)
22.00
25
0.00%
0.18
13.18%
2.77
Total Returns (Price + Dividend) 
Latest dividend: 0.08000000000000002 per share ex-dividend date: Sep-15-2011
Risk Adjusted Returns v/s
Returns Beta

News
Jai Balaji Industries Ltd is Rated Strong Sell
Jai Balaji Industries Ltd is rated Strong Sell by MarketsMOJO, with this rating last updated on 15 June 2026. While the rating change occurred on that date, the analysis and financial metrics discussed here reflect the stock’s current position as of 27 June 2026, providing investors with the latest insights into the company’s performance and outlook.
Read full news article
Jai Balaji Industries Ltd Locks at Upper Circuit With 1.98% Gain — Buyers Queue, Sellers Absent
At Rs 74.92, the buying was done — not because demand dried up, but because the exchange wouldn't let the stock go any higher. Jai Balaji Industries Ltd locked at its upper circuit of 5% on 23 Jun 2026, with buyers queuing and no sellers willing to part with shares.
Read full news article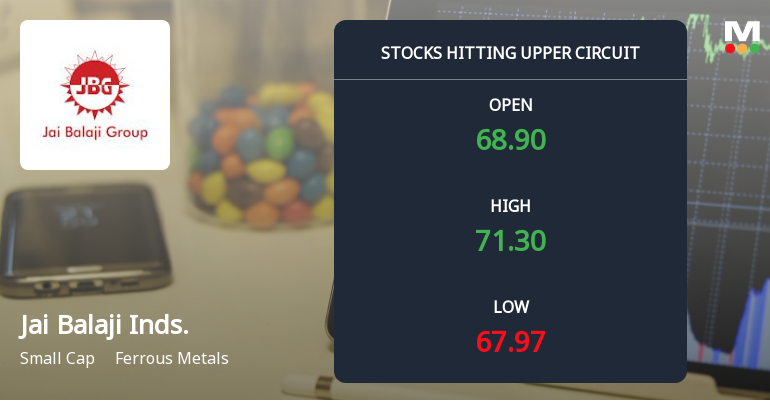
Jai Balaji Industries Ltd Locks at Upper Circuit With 5% Gain — Buyers Queue, Sellers Absent
At Rs 71.36, the buying was done — not because demand dried up, but because the exchange wouldn't let the stock go any higher. Jai Balaji Industries Ltd locked at its upper circuit of 5% on 22 Jun 2026, with buyers queuing and no sellers willing to part with shares.
Read full news article Announcements
Jai Balaji Industries Limited - Reply to Clarification Sought
03-Dec-2019 | Source : NSEJai Balaji Industries Limitedtries Limited with respect to announcement dated 14-Nov-2019, regarding Board meeting held on November 14, 2019. On basis of above the Company was required to clarify following: 1. Confirmation from Independent Director that there are no material reasons other than that provided. The response of the Company is attached.
Jai Balaji Industries Limited - Other General Purpose
28-Nov-2019 | Source : NSEJai Balaji Industries Limited has submitted to the Exchange a copy of disclosure of Related Party Transactions on a consolidated basis for the half-year ended September 30, 2019 .
Jai Balaji Industries Limited - Outcome of Board Meeting
15-Nov-2019 | Source : NSEJai Balaji Industries Limited has informed the Exchange regarding Board meeting held on November 14, 2019.
Corporate Actions

No Upcoming Board Meetings

Jai Balaji Industries Ltd has declared 4% dividend, ex-date: 15 Sep 11

Jai Balaji Industries Ltd has announced 2:10 stock split, ex-date: 17 Jan 25

No Bonus history available

No Rights history available
Quality key factors
Valuation key factors
Technicals key factors
 Technical Indicator Scale: Bearish, Mildly Bearish, Sideways, Mildly Bullish, Bullish Turned
 Shareholding Snapshot : Mar 2026
Shareholding Compare (%holding)
Promoters
31.0913
Held by 5 Schemes (0.09%)
Held by 40 FIIs (3.0%)
Hariaksh Industries Private Limited (17.54%)
Mahananda Securities Limited (5.03%)
10.63%
Quarterly Results Snapshot (Standalone) - Mar'26 - YoY

YoY Growth in quarter ended Mar 2026 is 9.79% vs -13.87% in Mar 2025
YoY Growth in quarter ended Mar 2026 is -71.69% vs -72.35% in Mar 2025
Half Yearly Results Snapshot (Consolidated) - Sep'25

Growth in half year ended Sep 2025 is -17.23% vs 8.11% in Sep 2024
Growth in half year ended Sep 2025 is -73.19% vs -2.69% in Sep 2024
Nine Monthly Results Snapshot (Standalone) - Dec'25
YoY Growth in nine months ended Dec 2025 is -15.17% vs 4.23% in Dec 2024
YoY Growth in nine months ended Dec 2025 is -77.49% vs -20.47% in Dec 2024
Annual Results Snapshot (Standalone) - Mar'26
YoY Growth in year ended Mar 2026 is -8.92% vs -0.98% in Mar 2025
YoY Growth in year ended Mar 2026 is -76.71% vs -36.57% in Mar 2025
About Jai Balaji Industries Ltd

Company Coordinates


