
Compare Sunflag Iron with Similar Stocks
Dashboard
Strong ability to service debt as the company has a low Debt to EBITDA ratio of 1.10 times
Poor long term growth as Operating profit has grown by an annual rate 14.60% of over the last 5 years
Flat results in Mar 26
With ROE of 2.4, it has a Very Expensive valuation with a 0.7 Price to Book Value
Despite the size of the company, domestic mutual funds hold only 0.04% of the company
Consistent Returns over the last 3 years
Stock DNA
Ferrous Metals
INR 6,456 Cr (Small Cap)
31.00
25
0.20%
0.03
2.36%
0.72
Total Returns (Price + Dividend) 
Latest dividend: 0.7 per share ex-dividend date: Sep-12-2025
Risk Adjusted Returns v/s
Returns Beta

News
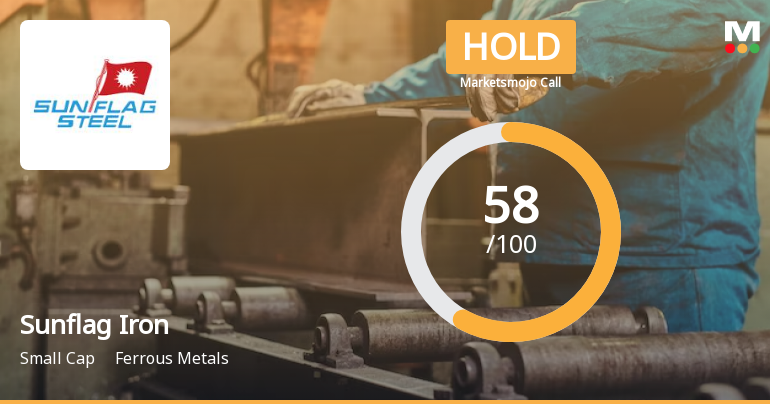
Sunflag Iron & Steel Company Ltd is Rated Hold
Sunflag Iron & Steel Company Ltd is rated 'Hold' by MarketsMOJO, with this rating last updated on 27 April 2026. However, the analysis and financial metrics discussed below reflect the stock's current position as of 03 July 2026, providing investors with an up-to-date view of the company’s fundamentals, returns, and market standing.
Read full news article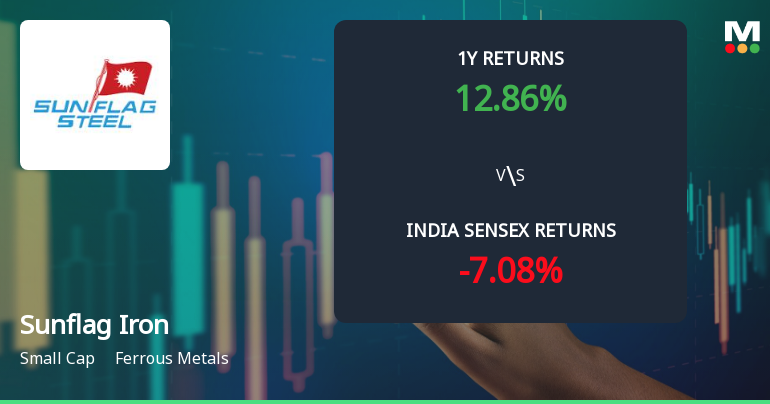
Sunflag Iron & Steel Company Ltd Sees Bullish Momentum Shift Amid Technical Upgrades
Sunflag Iron & Steel Company Ltd has demonstrated a notable shift in price momentum, supported by a series of bullish technical indicators that suggest strengthening investor confidence. The stock’s recent performance, coupled with upgraded technical grades, positions it favourably within the ferrous metals sector despite mixed broader market signals.
Read full news article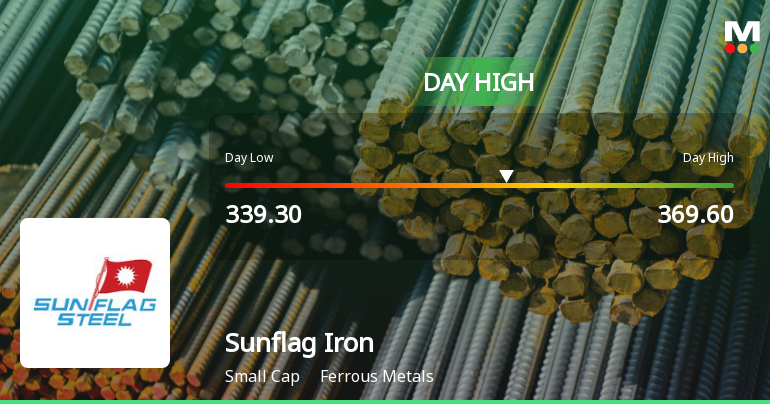
Sunflag Iron & Steel Company Ltd Surges 8.32% to Day's High of Rs 349.85 — Outperforms Sector by 2.32 Percentage Points
The Sensex advanced 0.57% on 2 Jul 2026, yet Sunflag Iron & Steel Company Ltd outpaced the broader market with an 8.32% gain, reaching an intraday peak of Rs 349.85. This 2.32 percentage-point outperformance over its Ferrous Metals sector peers highlights a distinctly stock-specific rally rather than a market-wide lift.
Read full news article Announcements
Sunflag Iron And Steel Company Limited - Outcome of Board Meeting
13-Nov-2019 | Source : NSESunflag Iron And Steel Company Limited has informed the Exchange regarding Board meeting held on November 12, 2019.
Sunflag Iron And Steel Company Limited - Trading Window
04-Nov-2019 | Source : NSESunflag Iron And Steel Company Limited has informed the Exchange regarding the Trading Window closure pursuant to SEBI (Prohibition of Insider Trading) Regulations, 2015
Reply to Clarification Sought
20-Sep-2019 | Source : NSE
| SUNFLAG:The Exchange had sought clarification from Sunflag Iron And Steel Company Limited with respect to announcement dated 10-Sep-2019, regarding Credit Rating. On basis of above the Company was required to clarify following: 1. In case of downward rating, the disclosure may include reasons published by rating agency for such downward rating.2. Promptly notify the Exchange, but not later than 24 hoursThe response of the Company is attached. |
Corporate Actions

No Upcoming Board Meetings

Sunflag Iron & Steel Company Ltd has declared 7% dividend, ex-date: 12 Sep 25

No Splits history available

No Bonus history available

No Rights history available
Quality key factors
Valuation key factors
Technicals key factors
 Technical Indicator Scale: Bearish, Mildly Bearish, Sideways, Mildly Bullish, Bullish Turned
 Shareholding Snapshot : Mar 2026
Shareholding Compare (%holding)
Promoters
None
Held by 4 Schemes (0.02%)
Held by 33 FIIs (0.54%)
Sunflag Ltd (36.21%)
Daido Steel Co Ltd (10%)
32.62%
Quarterly Results Snapshot (Consolidated) - Mar'26 - QoQ

QoQ Growth in quarter ended Mar 2026 is 6.18% vs -3.14% in Dec 2025

QoQ Growth in quarter ended Mar 2026 is -42.83% vs 31.65% in Dec 2025
Half Yearly Results Snapshot (Consolidated) - Sep'25
Growth in half year ended Sep 2025 is 13.39% vs 7.18% in Sep 2024
Growth in half year ended Sep 2025 is 57.45% vs 6.27% in Sep 2024
Nine Monthly Results Snapshot (Consolidated) - Dec'25
YoY Growth in nine months ended Dec 2025 is 10.79% vs 6.26% in Dec 2024
YoY Growth in nine months ended Dec 2025 is 41.46% vs 18.12% in Dec 2024
Annual Results Snapshot (Consolidated) - Mar'26
YoY Growth in year ended Mar 2026 is 11.42% vs 3.52% in Mar 2025
YoY Growth in year ended Mar 2026 is 24.86% vs 12.89% in Mar 2025
About Sunflag Iron & Steel Company Ltd

Company Coordinates


