Maithan Alloys

  • Market Cap: Small Cap
  • Industry: Ferrous Metals
  • ISIN: INE683C01011
  • NSEID: MAITHANALL
  • BSEID: 590078
INR
976.50
-5.65 (-0.58%)
BSENSE

Aug 31, 03:30 PM

BSE+NSE Vol: 31.96 k

  • Price Points
  • Score
  • Mojo Parameters
  • Total Return
  • News and Corporate Actions
  • Key factors
  • Shareholding
  • Financials
  • CompanyCV
stock-summaryPrice Point
High/Low

1Day

52 Week

Valuation
Technical
Day's Volume

CASH

31.96 k (-1.04%) Volume

Shareholding (Jun 2026)

FII

1.06%

Held by 38 FIIs

DII

0.02%

Held by 0 DIIs

Promoter

74.96%

Why is Maithan Alloys Ltd. falling/rising?

31-Aug-2026

As of 30-Aug, Maithan Alloys Ltd. is facing a stock price decline to 982.45, down 1.06%. This drop is due to underperformance in its sector, significant profit decreases, and declining investor participation, despite being net-debt free and having an attractive valuation.

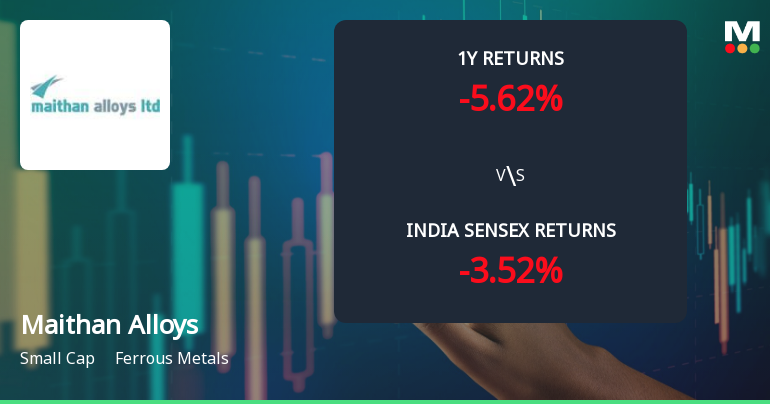
As of 30-Aug, Maithan Alloys Ltd. is experiencing a decline in its stock price, currently at 982.45, which reflects a change of -10.55 or -1.06%. This downward movement can be attributed to several factors. The stock has underperformed its sector by -1.17% today and has been on a consecutive fall for the last two days, resulting in a total decline of -2.59% during this period. <BR><BR>Additionally, the stock's performance relative to the benchmark Sensex shows a mixed picture; while it has outperformed the Sensex over the past week and month, it has underperformed in the year-to-date and one-year periods, with returns of -3.67% and -5.62%, respectively. The company's profits have significantly decreased by -59.1% over the past year, contributing to investor concerns.<BR><BR>Investor participation has also been declining, as indicated by a -26.27% drop in delivery volume compared to the five-day average. Although the stock is net-debt free and has an attractive valuation with a price to book value of 0.7, these positive aspects are overshadowed by the recent performance trends and falling investor interest, leading to the current decline in stock price.

View full answer

Should I buy, sell or hold Maithan Alloys Ltd.?

31-Aug-2026

Who are in the management team of Maithan Alloys?

14-Aug-2026

The management team of Maithan Alloys includes S C Agarwalla (Chairman & Managing Director), Subodh Agarwalla (Whole Time Director & CEO), and several independent and non-executive directors, playing a key role in the company's governance and strategy.

The management team of Maithan Alloys includes the following key members:<BR><BR>1. **S C Agarwalla** - Chairman & Managing Director<BR>2. **Subodh Agarwalla** - Whole Time Director & CEO<BR>3. **Nand Kishore Agarwal** - Non-Executive & Independent Director<BR>4. **Rajesh K Shah** - Company Secretary<BR>5. **P K Venkatramani** - Non-Executive & Independent Director<BR>6. **Kalpana Biswass Kundu** - Non-Executive & Independent Director<BR>7. **Ashok Bhandari** - Non-Executive & Independent Director<BR>8. **Vivek Kaul** - Non-Executive & Non-Independent Director<BR>9. **Srinivas Peddi** - Additional Non-Executive Director<BR><BR>This team plays a crucial role in the governance and strategic direction of the company.

View full answer

What does Maithan Alloys do?

14-Aug-2026

Maithan Alloys Ltd. manufactures and exports bulk Ferro alloys in the Ferrous Metals industry, with a market cap of INR 2,870 Cr. As of June 2026, it reported net sales of 540 Cr and a net profit of 393 Cr.

Overview: <BR>Maithan Alloys Ltd. is primarily engaged in the manufacturing and exporting of bulk Ferro alloys and operates within the Ferrous Metals industry, categorized as a Small Cap company.<BR><BR>History: <BR>Maithan Alloys Ltd. was incorporated in an unspecified year and has maintained its status as a manufacturer and exporter of Ferro alloys. The latest quarterly results reported are for June 2026, showing net sales and profit figures.<BR><BR>Financial Snapshot: <BR>- Net Sales: 540 Cr (Quarterly Results - Jun 2026) <BR>- Net Profit: 393 Cr (Quarterly Results - Jun 2026) <BR>- Market Cap: INR 2,870 Cr (Small Cap) <BR><BR>Key Metrics: <BR>- P/E: 7.00 <BR>- Industry P/E: 12 <BR>- Dividend Yield: 1.71% <BR>- Debt Equity: -0.37 <BR>- Return on Equity: 10.46% <BR>- Price to Book: 0.70 <BR><BR>Contact Details: <BR>Address: Ideal Centre 4th Floor, 9 A J C Bose Road Kolkata West Bengal : 700017 <BR>Tel: 91-33-64502228 <BR>Email: kolkata@maithanalloys.com <BR>Website: http://www.maithanalloys.com

View full answer

Who are the peers of the Maithan Alloys?

14-Aug-2026

Maithan Alloys' peers include NMDC Steel, Indian Metals, Kirl. Ferrous, Sunflag Iron, Jai Balaji Inds., Prakash Industri, Mukand, S.A.L Steel, and Neetu Yoshi. In terms of management risk, growth, and capital structure, they vary, with Indian Metals showing the highest 1-year return at 80.14% and Maithan Alloys at -9.46%.

Peers: The peers of Maithan Alloys are NMDC Steel, Indian Metals, Kirl. Ferrous, Sunflag Iron, Jai Balaji Inds., Prakash Industri, Mukand, S.A.L Steel, and Neetu Yoshi.<BR><BR>Quality Snapshot: Excellent management risk is observed at Kirl. Ferrous and Neetu Yoshi, while Average management risk is found at NMDC Steel, Indian Metals, Sunflag Iron, Jai Balaji Inds., and Maithan Alloys. Below Average management risk is present at Prakash Industri, Mukand, and S.A.L Steel. In terms of growth, Excellent growth is seen at NMDC Steel and Jai Balaji Inds., while Below Average growth is noted at Indian Metals, Kirl. Ferrous, Sunflag Iron, Maithan Alloys, Prakash Industri, Mukand, and S.A.L Steel, and the rest. Good capital structure is held by Kirl. Ferrous and Neetu Yoshi, while Excellent capital structure is noted at Indian Metals, Maithan Alloys, and Prakash Industri, and the rest have Below Average or Average capital structures.<BR><BR>Return Snapshot: The peer with the highest 1-year return is Indian Metals at 80.14%, while Kirl. Ferrous has the lowest at -19.74%. Maithan Alloys has a 1-year return of -9.46%, which is lower than both extremes. Additionally, the six-month return is negative for Indian Metals, Kirl. Ferrous, Prakash Industri, Mukand, and S.A.L Steel.

View full answer

How big is Maithan Alloys?

14-Aug-2026

As of 14th August, Maithan Alloys Ltd. has a market capitalization of 2,853.00 Cr, classifying it as a Small Cap company, with recent net sales of 2,079.81 Cr and net profit of 290.55 Cr over the latest four quarters.

As of 14th August, <BR><BR>Market Cap: Maithan Alloys Ltd. has a market capitalization of 2,853.00 Cr, classifying it as a Small Cap company.<BR><BR>Recent Quarterly Performance: The sum of Net Sales for the latest 4 quarters is 2,079.81 Cr, while the sum of Net Profit for the same period is 290.55 Cr.<BR><BR>Balance Sheet Snapshot: The reporting period for the latest annual data is March 2025. Shareholder's Funds stand at 3,746.08 Cr, and Total Assets are valued at 4,848.94 Cr.

View full answer

When is the next results date for Maithan Alloys Ltd.?

07-Aug-2026

The next results date for Maithan Alloys Ltd. is 13 August 2026.

The next results date for Maithan Alloys Ltd. is scheduled for 13 August 2026.

View full answer

Are Maithan Alloys Ltd. latest results good or bad?

20-May-2026

Maithan Alloys Ltd. reported a significant net loss of ₹70.44 crores, a 179.24% decline from the previous quarter, mainly due to a sharp drop in other income. However, operationally, the company showed positive signs with a 14.05% revenue increase and improved operating margins, indicating potential recovery in core business performance.

Maithan Alloys Ltd.'s latest results present a mixed picture. On one hand, the company reported a significant decline in net profit, posting a loss of ₹70.44 crores, which is a drastic drop of 179.24% compared to the previous quarter. This loss was primarily driven by a sharp negative swing in other income, which turned to a loss of ₹158.96 crores from a positive figure in the prior quarter.<BR><BR>On the other hand, the operational performance shows promising signs. The company achieved a revenue increase of 14.05% quarter-on-quarter, reaching ₹559.18 crores, and its operating margin (excluding other income) improved to 19.01%, the highest in eight quarters. This indicates that the core business operations are gaining momentum and becoming more efficient.<BR><BR>Overall, while the headline loss is concerning, the underlying operational metrics suggest that Maithan Alloys is on a recovery path. Investors may need to weigh the negative impact of exceptional items against the positive trends in operational performance to form a complete view of the company's health.

View full answer

Is Maithan Alloys technically bullish or bearish?

18-Nov-2025

As of November 17, 2025, Maithan Alloys shows a mildly bearish trend with bearish indicators across multiple time frames, despite a slightly bullish daily moving average.

As of 17 November 2025, the technical trend for Maithan Alloys has changed from sideways to mildly bearish. The current stance is bearish with a moderate strength. The weekly MACD is bearish, and both the weekly and monthly Bollinger Bands indicate bearish conditions. The KST is mildly bearish on the weekly and bearish on the monthly, while the Dow Theory also reflects a mildly bearish outlook across both time frames. Although the daily moving averages show a mildly bullish signal, this is outweighed by the overall bearish indicators. The stock has underperformed compared to the Sensex across multiple time frames, further supporting the bearish sentiment.

View full answer

How has been the historical performance of Maithan Alloys?

14-Nov-2025

Maithan Alloys has experienced fluctuating net sales and profits, with a decline in sales from 2,884.95 Cr in Mar'23 to 1,805.61 Cr in Mar'25, but an increase in profit after tax to 630.91 Cr in Mar'25. The company improved its cash flow from operating activities significantly, despite rising total liabilities.

Answer:<BR>The historical performance of Maithan Alloys shows a fluctuating trend in net sales and profits over the years, with significant variations in operating income and expenses.<BR><BR>Breakdown:<BR>Maithan Alloys' net sales have seen a decline from 2,884.95 Cr in Mar'23 to 1,805.61 Cr in Mar'25, with a notable drop in operating profit from 1,100.32 Cr in Mar'22 to 897.36 Cr in Mar'25. The total expenditure, excluding depreciation, has also decreased from 2,298.71 Cr in Mar'23 to 1,629.09 Cr in Mar'25, reflecting a reduction in costs. The profit before tax increased from 449.53 Cr in Mar'24 to 852.43 Cr in Mar'25, while the profit after tax rose to 630.91 Cr in Mar'25 from 348.96 Cr in Mar'24. The company's total assets grew from 3,139.96 Cr in Mar'23 to 4,848.94 Cr in Mar'25, driven by an increase in reserves and current assets. However, total liabilities also increased significantly from 3,468.08 Cr in Mar'24 to 4,848.94 Cr in Mar'25. Cash flow from operating activities improved to 49.00 Cr in Mar'25, contrasting with a negative cash flow of -408.00 Cr in Mar'24, although the net cash outflow was -19.00 Cr in Mar'25. Overall, while Maithan Alloys has experienced fluctuations in sales and profits, it has shown resilience in managing its expenses and improving its cash flow position.

View full answer

Is Maithan Alloys overvalued or undervalued?

18-Aug-2025

As of August 14, 2025, Maithan Alloys is considered an attractive investment opportunity in the ferrous metals industry, with strong performance metrics and a significant discount compared to peers, despite a recent downgrade in valuation grade.

As of 14 August 2025, the valuation grade for Maithan Alloys has moved from very attractive to attractive. The company is currently considered undervalued, with a PE ratio of 4.52, a Price to Book Value of 0.86, and an EV to EBITDA of 7.97. In comparison to its peers, Indian Metals has a PE ratio of 12.51, indicating that Maithan Alloys is trading at a significant discount relative to this competitor.<BR><BR>Despite the recent grade change, Maithan Alloys shows strong performance metrics, including a ROE of 16.82% and a dividend yield of 1.45%. While the stock has underperformed the Sensex on a year-to-date basis, it has outperformed over the past year with a return of 7.48% compared to the Sensex's 1.89%. Overall, the valuation metrics suggest that Maithan Alloys presents a compelling investment opportunity in the ferrous metals industry.

View full answer

Who are the top shareholders of the Maithan Alloys?

17-Jul-2025

The top shareholders of Maithan Alloys include promoters, with Sheela Devi Agarwalla holding 21.81%. Individual investors own 18.25%, while Foreign Institutional Investors hold 1.12%, and there are no mutual funds or pledged promoter holdings.

The top shareholders of Maithan Alloys primarily consist of the promoters, with Sheela Devi Agarwalla holding the highest individual stake at 21.81%. Additionally, individual investors collectively own 18.25% of the shares. There are 39 Foreign Institutional Investors (FIIs) that hold a total of 1.12% of the company's shares, while no mutual funds currently hold any shares in the company. There are no pledged promoter holdings reported.

View full answer

What is the bonus history of the Maithan Alloys?

06-Jun-2025

Maithan Alloys has issued bonuses twice: a 1:1 bonus on July 15, 2015, and a 1:2 bonus on June 19, 2010, demonstrating the company's commitment to rewarding shareholders.

Maithan Alloys has a history of bonus issues that includes two significant events. The latest bonus was a 1:1 issue announced with an ex-date of July 15, 2015, and the record date was July 16, 2015. Prior to that, there was a bonus issue on June 19, 2010, which was a 1:2 ratio, with the ex-date being June 17, 2010. This reflects the company's approach to rewarding its shareholders through bonus shares over the years.

View full answer

Has Maithan Alloys declared dividend?

06-Jun-2025

Yes, Maithan Alloys Ltd. has declared a dividend of 70% (₹3 per share) with an ex-date of June 6, 2025. While recent total returns have been negative, the company has shown strong growth over the longer term, particularly with a total return of 162.27% over the past five years.

Maithan Alloys Ltd. has declared a dividend.<BR><BR>Dividend Details:<BR>- Percentage announced: 70%<BR>- Amount per share: 3<BR>- Ex-date: 06 Jun 25<BR><BR>Dividend Yield: 0.84%<BR><BR>Total Returns by Period:<BR>In the last 6 months, the price return was -8.23%, the dividend return was 0.83%, resulting in a total return of -7.4%.<BR><BR>Over the past year, the price return was -4.49%, the dividend return was 1.31%, leading to a total return of -3.18%.<BR><BR>In the 2-year period, the price return was 11.02%, the dividend return was 2.20%, culminating in a total return of 13.22%.<BR><BR>For the 3-year period, the price return was 13.16%, the dividend return was 3.27%, resulting in a total return of 16.43%.<BR><BR>In the last 4 years, the price return was 30.78%, the dividend return was 3.32%, leading to a total return of 34.1%.<BR><BR>Over the past 5 years, the price return was 155.05%, the dividend return was 7.22%, culminating in a total return of 162.27%.<BR><BR>Overall, Maithan Alloys has declared a significant dividend, and while the recent total returns over shorter periods have been negative, the longer-term returns indicate strong growth, particularly over the 5-year period.

View full answer
iScoreScore
Click here to find our call on this stock
Strong Sell
Sell
Hold
Buy
Strong Buy

Dashboard

1

Poor long term growth as Operating profit has grown by an annual rate -7.02% of over the last 5 years

 
2

Flat results in Jun 26

3

Consistent Underperformance against the benchmark over the last 3 years

stock-summaryMojo Parameters

Mojo Parameters

Loading Valuation Snapshot...

Stock DNA

stock-summary
Industry

Ferrous Metals

stock-summary
Market cap

INR 2,855 Cr (Small Cap)

stock-summary
P/E

10.00

stock-summary
Industry P/E

13

stock-summary
Dividend Yield

1.73%

stock-summary
Debt Equity

-0.37

stock-summary
Return on Equity

10.46%

stock-summary
Price to Book

0.69

Revenue and Profits:
Net Sales:
540 Cr
(Quarterly Results - Jun 2026)
Net Profit:
393 Cr
stock-summaryTotal Returns
Total Returns (Price + Dividend) stock-summary
Dividend Yield (1.73%)
TimePeriod
Price Return
Dividend Return
Total Return
3 Months
-4.64%
0.57%
-4.07%
6 Months
-1.78%
1.79%
0.01%
1 Year
-6.23%
2.11%
-4.12%
2 Years
-15.15%
3.53%
-11.62%
3 Years
-4.83%
4.22%
-0.61%
4 Years
-5.72%
4.45%
-1.27%
5 Years
1.17%
5.19%
6.36%

Latest dividend: 11 per share ex-dividend date: May-22-2026

Risk Adjusted Returns v/s stock-summary
Returns Beta
Icon
Beta has not been calculated since enough price history is not available
stock-summaryNews & Corporate Actions

News

Maithan Alloys Gains 0.53%: 4 Key Factors Driving the Week’s Mixed Momentum

Announcements stock-summary

Maithan Alloys Limited - Analysts/Institutional Investor Meet/Con. Call Updates

18-Nov-2019 | Source : NSE

Maithan Alloys Limited has informed the Exchange regarding Analysts/Institutional Investor Meet/Con. Call Updates

Maithan Alloys Limited - Updates

13-Nov-2019 | Source : NSE

Maithan Alloys Limited has informed the Exchange regarding 'an Update on Auction of Impex Metal & Ferro Alloys Limited and that the Company vide letter dated 13th June, 2019 intimated that the Company had participated in the auction of Impex Metal & Ferro Alloys Limited (under liquidation) as a going concern wherein the Liquidator Officer declared the Company as H1 BIDDER (i.e. highest bidder) and necessary approval of Hon ble National Company Law Tribunal (NCLT) was awaited.

Maithan Alloys Limited - Updates

04-Nov-2019 | Source : NSE

Maithan Alloys Limited has informed the Exchange regarding 'Newspaper publication of Standalone & Consolidated Un-audited Financial Results for the quarter and half year ended on 30th September, 2019.'.

Corporate Actions stock-summary

stock-summary
BOARD MEETING

No Upcoming Board Meetings

stock-summary
DIVIDEND

Maithan Alloys Ltd. has declared 60% dividend, ex-date: 21 Sep 26

stock-summary
SPLITS

No Splits history available

stock-summary
BONUS

Maithan Alloys Ltd. has announced 1:1 bonus issue, ex-date: 15 Jul 15

stock-summary
RIGHTS

No Rights history available

stock-summaryKey Factors

Quality key factors stock-summary

Factor
Value
Sales Growth (5y)
1.61%
EBIT Growth (5y)
-7.02%
EBIT to Interest (avg)
100.00
Debt to EBITDA (avg)
1.02
Net Debt to Equity (avg)
-0.37
Sales to Capital Employed (avg)
0.79
Tax Ratio
26.38%
Dividend Payout Ratio
7.39%
Pledged Shares
0
Institutional Holding
1.07%
ROCE (avg)
35.14%
ROE (avg)
18.85%

Valuation key factors

Factor
Value
P/E Ratio
10
Industry P/E
13
Price to Book Value
0.68
EV to EBIT
5.02
EV to EBITDA
4.62
EV to Capital Employed
0.50
EV to Sales
0.63
PEG Ratio
NA
Dividend Yield
1.74%
ROCE (Latest)
9.00%
ROE (Latest)
10.46%

Technicals key factors

Indicator
Weekly
Monthly
MACD
Bearish
Bearish
RSI
No Signal
No Signal
Bollinger Bands
Bearish
Bearish
Moving Averages
Mildly Bullish (Daily)
KST
Mildly Bearish
Bearish
Dow Theory
Mildly Bullish
No Trend
OBV
No Trend
Bullish
stock-summary Technical Indicator Scale: Bearish, Mildly Bearish, Sideways, Mildly Bullish, Bullish  Turned 
stock-summaryShareholding
Shareholding Snapshot : Jun 2026stock-summary
Shareholding Compare (%holding) stock-summary
Majority shareholders

Promoters

Pledged Promoter Holdings

None

Mutual Funds

Held by 0 Schemes

FIIs

Held by 38 FIIs (1.06%)

Promoter with highest holding

Subhas Chandra Agarwalla (25.63%)

Highest Public shareholder

None

Individual Investors Holdings

18.76%

stock-summaryFinancial
[
  {
    "link": "quarterly",
    "btn_text": "All Quarterly Results",
    "header": "Quarterly Results Snapshot (Consolidated) - Jun'26 - QoQ",
    "rhs": [
      {
        "prefix": "Net Sales ",
        "suffix": "QoQ Growth in quarter ended Jun 2026 is -3.51% vs 14.05% in Mar 2026",
        "dir": -1
      },
      {
        "prefix": "Consolidated Net Profit ",
        "suffix": "QoQ Growth in quarter ended Jun 2026 is 657.98% vs -179.24% in Mar 2026",
        "dir": 1
      }
    ],
    "table": {
      "header": [
        "Jun'26",
        "Mar'26",
        "Change(%)"
      ],
      "body": [
        {
          "field": "Net Sales",
          "val1": "539.53",
          "val2": "559.18",
          "chgp": "-3.51%",
          "chgp_class": "negative"
        },
        {
          "field": "Operating Profit (PBDIT) excl Other Income",
          "val1": "90.83",
          "val2": "106.31",
          "chgp": "-14.56%",
          "chgp_class": "negative"
        },
        {
          "field": "Interest",
          "val1": "4.55",
          "val2": "14.03",
          "chgp": "-67.57%",
          "chgp_class": "positive"
        },
        {
          "field": "Exceptional Items",
          "val1": "0.00",
          "val2": "0.00",
          "chgp": "",
          "chgp_class": "neutral"
        },
        {
          "field": "Consolidate Net Profit",
          "val1": "393.04",
          "val2": "-70.44",
          "chgp": "657.98%",
          "chgp_class": "positive"
        },
        {
          "field": "Operating Profit Margin (Excl OI)",
          "val1": "16.84%",
          "val2": "19.01%",
          "chgp": "-2.17%",
          "chgp_class": "negative"
        }
      ]
    }
  },
  {
    "link": "half-yearly",
    "btn_text": "All Half Yearly Results",
    "header": "Half Yearly Results Snapshot (Consolidated) - Sep'25",
    "rhs": [
      {
        "prefix": "Net Sales ",
        "suffix": " Growth in half year ended Sep 2025 is 33.82% vs -0.95% in Sep 2024",
        "dir": 1
      },
      {
        "prefix": "Consolidated Net Profit ",
        "suffix": " Growth in half year ended Sep 2025 is -30.84% vs 393.97% in Sep 2024",
        "dir": -1
      }
    ],
    "table": {
      "header": [
        "Sep'25",
        "Sep'24",
        "Change(%)"
      ],
      "body": [
        {
          "field": "Net Sales",
          "val1": "1,123.13",
          "val2": "839.29",
          "chgp": "33.82%",
          "chgp_class": "positive"
        },
        {
          "field": "Operating Profit (PBDIT) excl Other Income",
          "val1": "97.51",
          "val2": "70.65",
          "chgp": "38.02%",
          "chgp_class": "positive"
        },
        {
          "field": "Interest",
          "val1": "26.41",
          "val2": "7.12",
          "chgp": "270.93%",
          "chgp_class": "negative"
        },
        {
          "field": "Exceptional Items",
          "val1": "0.00",
          "val2": "0.00",
          "chgp": "",
          "chgp_class": "neutral"
        },
        {
          "field": "Consolidate Net Profit",
          "val1": "415.19",
          "val2": "600.37",
          "chgp": "-30.84%",
          "chgp_class": "negative"
        },
        {
          "field": "Operating Profit Margin (Excl OI)",
          "val1": "8.68%",
          "val2": "8.42%",
          "chgp": "0.26%",
          "chgp_class": "positive"
        }
      ]
    }
  },
  {
    "link": "nine-monthly",
    "btn_text": "All Nine Monthly Results",
    "header": "Nine Monthly Results Snapshot (Consolidated) - Dec'25",
    "rhs": [
      {
        "prefix": "Net Sales ",
        "suffix": "YoY Growth in nine months ended Dec 2025 is 17.73% vs 5.79% in Dec 2024",
        "dir": 1
      },
      {
        "prefix": "Consolidated Net Profit ",
        "suffix": "YoY Growth in nine months ended Dec 2025 is -27.07% vs 234.11% in Dec 2024",
        "dir": -1
      }
    ],
    "table": {
      "header": [
        "Dec'25",
        "Dec'24",
        "Change(%)"
      ],
      "body": [
        {
          "field": "Net Sales",
          "val1": "1,613.41",
          "val2": "1,370.38",
          "chgp": "17.73%",
          "chgp_class": "positive"
        },
        {
          "field": "Operating Profit (PBDIT) excl Other Income",
          "val1": "152.92",
          "val2": "100.05",
          "chgp": "52.84%",
          "chgp_class": "positive"
        },
        {
          "field": "Interest",
          "val1": "30.07",
          "val2": "13.52",
          "chgp": "122.41%",
          "chgp_class": "negative"
        },
        {
          "field": "Exceptional Items",
          "val1": "0.00",
          "val2": "0.00",
          "chgp": "",
          "chgp_class": "neutral"
        },
        {
          "field": "Consolidate Net Profit",
          "val1": "504.09",
          "val2": "691.20",
          "chgp": "-27.07%",
          "chgp_class": "negative"
        },
        {
          "field": "Operating Profit Margin (Excl OI)",
          "val1": "9.48%",
          "val2": "7.30%",
          "chgp": "2.18%",
          "chgp_class": "positive"
        }
      ]
    }
  },
  {
    "link": "annual",
    "btn_text": "All Annual Results",
    "header": "Annual Results Snapshot (Consolidated) - Mar'26",
    "rhs": [
      {
        "prefix": "Net Sales ",
        "suffix": "YoY Growth in year ended Mar 2026 is 20.32% vs 4.45% in Mar 2025",
        "dir": 1
      },
      {
        "prefix": "Consolidated Net Profit ",
        "suffix": "YoY Growth in year ended Mar 2026 is -31.19% vs 80.59% in Mar 2025",
        "dir": -1
      }
    ],
    "table": {
      "header": [
        "Mar'26",
        "Mar'25",
        "Change(%)"
      ],
      "body": [
        {
          "field": "Net Sales",
          "val1": "2,172.59",
          "val2": "1,805.61",
          "chgp": "20.32%",
          "chgp_class": "positive"
        },
        {
          "field": "Operating Profit (PBDIT) excl Other Income",
          "val1": "259.23",
          "val2": "176.52",
          "chgp": "46.86%",
          "chgp_class": "positive"
        },
        {
          "field": "Interest",
          "val1": "44.10",
          "val2": "21.64",
          "chgp": "103.79%",
          "chgp_class": "negative"
        },
        {
          "field": "Exceptional Items",
          "val1": "0.00",
          "val2": "0.00",
          "chgp": "",
          "chgp_class": "neutral"
        },
        {
          "field": "Consolidate Net Profit",
          "val1": "433.65",
          "val2": "630.18",
          "chgp": "-31.19%",
          "chgp_class": "negative"
        },
        {
          "field": "Operating Profit Margin (Excl OI)",
          "val1": "11.93%",
          "val2": "9.78%",
          "chgp": "2.15%",
          "chgp_class": "positive"
        }
      ]
    }
  }
]

Quarterly Results Snapshot (Consolidated) - Jun'26 - QoQstock-summary

Jun'26
Mar'26
Change(%)
Net Sales
539.53
559.18
-3.51%
Operating Profit (PBDIT) excl Other Income
90.83
106.31
-14.56%
Interest
4.55
14.03
-67.57%
Exceptional Items
0.00
0.00
Consolidate Net Profit
393.04
-70.44
657.98%
Operating Profit Margin (Excl OI)
16.84%
19.01%
-2.17%
Values in Rs Cr.
Direction Arrows
Net Sales

QoQ Growth in quarter ended Jun 2026 is -3.51% vs 14.05% in Mar 2026

Direction Arrows
Consolidated Net Profit

QoQ Growth in quarter ended Jun 2026 is 657.98% vs -179.24% in Mar 2026

Half Yearly Results Snapshot (Consolidated) - Sep'25stock-summary

Sep'25
Sep'24
Change(%)
Net Sales
1,123.13
839.29
33.82%
Operating Profit (PBDIT) excl Other Income
97.51
70.65
38.02%
Interest
26.41
7.12
270.93%
Exceptional Items
0.00
0.00
Consolidate Net Profit
415.19
600.37
-30.84%
Operating Profit Margin (Excl OI)
8.68%
8.42%
0.26%
Values in Rs Cr.
Direction Arrows
Net Sales

Growth in half year ended Sep 2025 is 33.82% vs -0.95% in Sep 2024

Direction Arrows
Consolidated Net Profit

Growth in half year ended Sep 2025 is -30.84% vs 393.97% in Sep 2024

Nine Monthly Results Snapshot (Consolidated) - Dec'25stock-summary

Dec'25
Dec'24
Change(%)
Net Sales
1,613.41
1,370.38
17.73%
Operating Profit (PBDIT) excl Other Income
152.92
100.05
52.84%
Interest
30.07
13.52
122.41%
Exceptional Items
0.00
0.00
Consolidate Net Profit
504.09
691.20
-27.07%
Operating Profit Margin (Excl OI)
9.48%
7.30%
2.18%
Values in Rs Cr.
Direction Arrows
Net Sales

YoY Growth in nine months ended Dec 2025 is 17.73% vs 5.79% in Dec 2024

Direction Arrows
Consolidated Net Profit

YoY Growth in nine months ended Dec 2025 is -27.07% vs 234.11% in Dec 2024

Annual Results Snapshot (Consolidated) - Mar'26stock-summary

Mar'26
Mar'25
Change(%)
Net Sales
2,172.59
1,805.61
20.32%
Operating Profit (PBDIT) excl Other Income
259.23
176.52
46.86%
Interest
44.10
21.64
103.79%
Exceptional Items
0.00
0.00
Consolidate Net Profit
433.65
630.18
-31.19%
Operating Profit Margin (Excl OI)
11.93%
9.78%
2.15%
Values in Rs Cr.
Direction Arrows
Net Sales

YoY Growth in year ended Mar 2026 is 20.32% vs 4.45% in Mar 2025

Direction Arrows
Consolidated Net Profit

YoY Growth in year ended Mar 2026 is -31.19% vs 80.59% in Mar 2025

stock-summaryCompany CV
About Maithan Alloys Ltd. stock-summary
stock-summary
Maithan Alloys Ltd.
Small Cap
Ferrous Metals
Maithan Alloys Limited is primarily engaged in the business of manufacturing and exporting of all three bulk Ferro alloys- Ferro Manganese, Silico Manganese and Ferro Silicon. It is also engaged in the generation and supply of Wind Power and has Captive Power Plant. Headquartered in Kolkata, the company is promoted and managed by the Asansol-based Agarwalla family that possesses extensive multidecade industry experience and exposure.
Company Coordinates stock-summary
Company Details
Ideal Centre 4th Floor, 9 A J C Bose Road Kolkata West Bengal : 700017
stock-summary
Tel: 91-33-64502228
stock-summary
kolkata@maithanalloys.com
Registrar Details
Maheshwari Datamatics Pvt Ltd , 6 Mangoe Lane , 2nd Floor, Calcutta