
Compare Jai Corp with Similar Stocks
Dashboard
Poor Management Efficiency with a low ROE of 5.19%
- The company has been able to generate a Return on Equity (avg) of 5.19% signifying low profitability per unit of shareholders funds
Poor long term growth as Net Sales has grown by an annual rate of 1.75% and Operating profit at 4.55% over the last 5 years
Flat results in Mar 26
With ROE of 11.4, it has a Expensive valuation with a 1.3 Price to Book Value
Despite the size of the company, domestic mutual funds hold only 0.14% of the company
Stock DNA
Plastic Products - Industrial
INR 1,974 Cr (Small Cap)
11.00
23
4.93%
-0.33
11.44%
1.34
Total Returns (Price + Dividend) 
Latest dividend: 0.5 per share ex-dividend date: Sep-19-2025
Risk Adjusted Returns v/s
Returns Beta

News

Jai Corp Ltd is Rated Sell
Jai Corp Ltd is rated 'Sell' by MarketsMOJO, with this rating last updated on 01 June 2026. However, the analysis and financial metrics discussed here reflect the stock's current position as of 09 June 2026, providing investors with the latest insights into the company’s performance and outlook.
Read full news article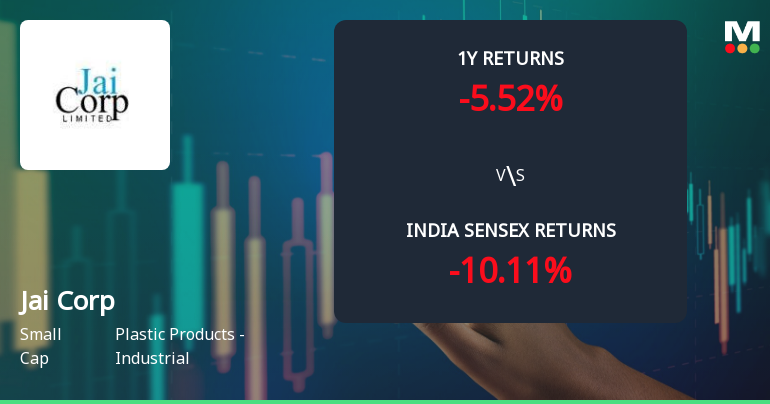
Jai Corp Ltd Technical Momentum Shifts Amid Mixed Market Signals
Jai Corp Ltd, a small-cap player in the Plastic Products - Industrial sector, has experienced a notable shift in its technical momentum, moving from a mildly bearish stance to a sideways trend. Despite a recent downgrade in its Mojo Grade from Hold to Sell, the stock exhibits a complex interplay of technical indicators that suggest cautious optimism amid persistent challenges.
Read full news article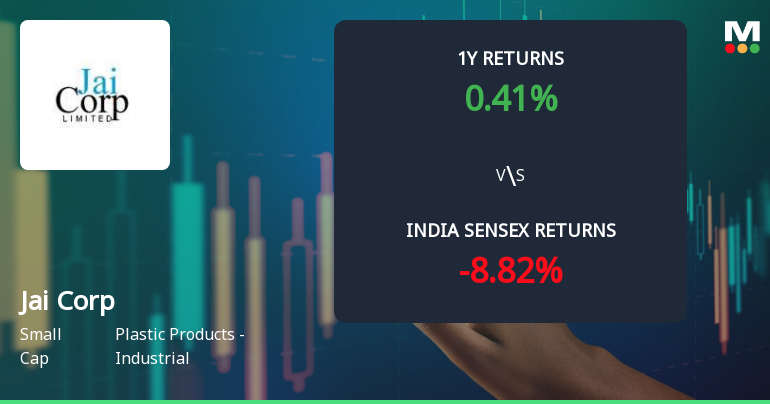
Jai Corp Ltd Technical Momentum Shifts Amid Bearish Sentiment
Jai Corp Ltd, a small-cap player in the Plastic Products - Industrial sector, has experienced a notable shift in its technical momentum, moving from a sideways trend to a mildly bearish stance. Despite some mildly bullish signals on weekly and monthly MACD and KST indicators, the overall technical picture remains mixed, prompting a downgrade in its Mojo Grade from Hold to Sell as of 1 June 2026.
Read full news article Announcements
Board Meeting Outcome for Outcome Of Board Meeting
30-May-2026 | Source : BSEOutcome of Board Meeting.
Audited Financial Results 31.03.2026
30-May-2026 | Source : BSEAudited standalone and consolidated financial results for 31st March 2026.
Announcement under Regulation 30 (LODR)-Dividend Updates
30-May-2026 | Source : BSERecommendation of final dividend.
Corporate Actions

No Upcoming Board Meetings

Jai Corp Ltd has declared 50% dividend, ex-date: 19 Sep 25

Jai Corp Ltd has announced 1:10 stock split, ex-date: 05 Oct 07

Jai Corp Ltd has announced 1:1 bonus issue, ex-date: 05 Oct 07

No Rights history available
Quality key factors
Valuation key factors
Technicals key factors
 Technical Indicator Scale: Bearish, Mildly Bearish, Sideways, Mildly Bullish, Bullish Turned
 Shareholding Snapshot : Mar 2026
Shareholding Compare (%holding)
Promoters
None
Held by 7 Schemes (0.04%)
Held by 30 FIIs (0.8%)
Harsh Jain (13.05%)
Life Insurance Corporation Of India (1.53%)
20.2%
Quarterly Results Snapshot (Consolidated) - Mar'26 - QoQ

QoQ Growth in quarter ended Mar 2026 is 3.88% vs -20.67% in Dec 2025
QoQ Growth in quarter ended Mar 2026 is 18.51% vs -34.58% in Dec 2025
Half Yearly Results Snapshot (Consolidated) - Sep'25

Growth in half year ended Sep 2025 is 8.32% vs 9.79% in Sep 2024
Growth in half year ended Sep 2025 is 323.91% vs 80.02% in Sep 2024
Nine Monthly Results Snapshot (Consolidated) - Dec'25
YoY Growth in nine months ended Dec 2025 is 2.98% vs 12.34% in Dec 2024
YoY Growth in nine months ended Dec 2025 is 243.03% vs 48.75% in Dec 2024
Annual Results Snapshot (Consolidated) - Mar'26
YoY Growth in year ended Mar 2026 is -0.65% vs 11.80% in Mar 2025
YoY Growth in year ended Mar 2026 is 154.35% vs 26.69% in Mar 2025
About Jai Corp Ltd

Company Coordinates


