
Compare Jain Irrigation with Similar Stocks
Dashboard
Poor Management Efficiency with a low ROCE of 4.94%
- The company has been able to generate a Return on Capital Employed (avg) of 4.94% signifying low profitability per unit of total capital (equity and debt)
Low ability to service debt as the company has a high Debt to EBITDA ratio of 5.32 times
Flat results in Mar 26
40.77% of Promoter Shares are Pledged
Below par performance in long term as well as near term
Stock DNA
Plastic Products - Industrial
INR 2,315 Cr (Small Cap)
75.00
36
0.00%
0.71
0.53%
0.39
Total Returns (Price + Dividend) 
Latest dividend: 1 per share ex-dividend date: Sep-12-2019
Risk Adjusted Returns v/s
Returns Beta

News

Jain Irrigation Systems Ltd is Rated Sell
Jain Irrigation Systems Ltd is rated 'Sell' by MarketsMOJO, with this rating last updated on 28 Jul 2025. However, the analysis and financial metrics discussed here reflect the stock's current position as of 06 July 2026, providing investors with an up-to-date view of the company’s fundamentals, returns, and market standing.
Read full news article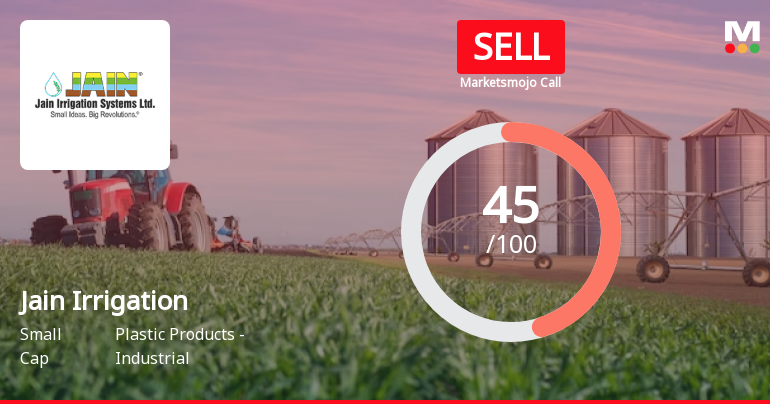
Jain Irrigation Systems Ltd is Rated Sell
Jain Irrigation Systems Ltd is rated 'Sell' by MarketsMOJO, with this rating last updated on 28 July 2025. However, the analysis and financial metrics discussed here reflect the stock's current position as of 25 June 2026, providing investors with an up-to-date view of the company’s fundamentals, returns, and market standing.
Read full news article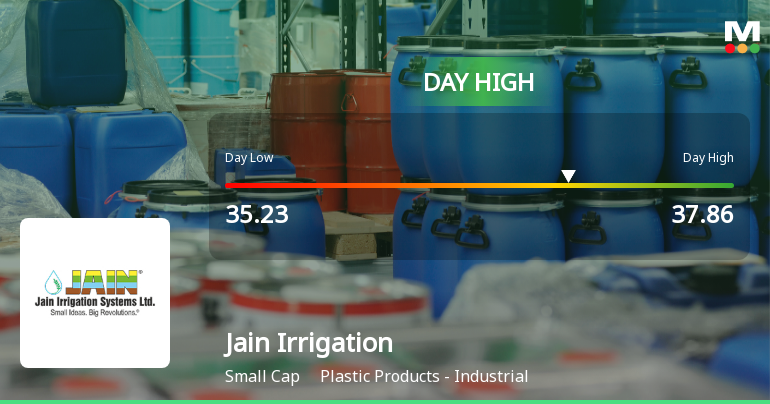
Jain Irrigation Systems Ltd Surges 7.01% to Day's High of Rs 37.86 — Outperforms Sector by 1.02 Percentage Points
The Sensex edged up a modest 0.07% on 23 Jun 2026, while Jain Irrigation Systems Ltd surged 7.01%, touching an intraday high of Rs 37.86. This 1.02 percentage-point outperformance over the Plastic Products - Industrial sector’s 5.99% gain highlights a stock-specific strength that rewrites the short-term narrative for this small-cap.
Read full news article Announcements
Jain Irrigation Systems Limited - Other General Purpose
26-Nov-2019 | Source : NSEJain Irrigation Systems Limited has informed the Exchange regarding Disclosure of Related Party Transactions pursuant to Regulation 23 (9) of the SEBI (Listing Obligations and Disclosure Requirements) Regulations, 2015.
Jain Irrigation Systems Limited - Analysts/Institutional Investor Meet/Con. Call Updates
15-Nov-2019 | Source : NSEJain Irrigation Systems Limited has informed the Exchange regarding Analysts/Institutional Investor Meet/Con. Call Updates
Jain Irrigation Systems Limited - Clarification
09-Oct-2019 | Source : NSEJain Irrigation Systems Limited with respect to announcement dated 27-Sep-2019, regarding 'Disclosure about the signing of Inter Creditor Agreement.'
Corporate Actions

No Upcoming Board Meetings

Jain Irrigation Systems Ltd has declared 50% dividend, ex-date: 12 Sep 19

Jain Irrigation Systems Ltd has announced 2:10 stock split, ex-date: 29 Oct 10

Jain Irrigation Systems Ltd has announced 1:20 bonus issue, ex-date: 08 Nov 11

No Rights history available
Quality key factors
Valuation key factors
Technicals key factors
 Technical Indicator Scale: Bearish, Mildly Bearish, Sideways, Mildly Bullish, Bullish Turned
 Shareholding Snapshot : Mar 2026
Shareholding Compare (%holding)
Non Institution
40.7681
Held by 3 Schemes (0.0%)
Held by 68 FIIs (3.91%)
Jalgaon Investments Private Limited (17.05%)
Mandala Rose Co-investment Limited (5.07%)
36.53%
Quarterly Results Snapshot (Consolidated) - Mar'26 - YoY

YoY Growth in quarter ended Mar 2026 is 4.30% vs 1.28% in Mar 2025

YoY Growth in quarter ended Mar 2026 is -141.54% vs 428.90% in Mar 2025
Half Yearly Results Snapshot (Consolidated) - Sep'25
Growth in half year ended Sep 2025 is 11.54% vs -12.83% in Sep 2024
Growth in half year ended Sep 2025 is 695.11% vs -91.67% in Sep 2024
Nine Monthly Results Snapshot (Consolidated) - Dec'25
YoY Growth in nine months ended Dec 2025 is 13.52% vs -8.82% in Dec 2024
YoY Growth in nine months ended Dec 2025 is -372.14% vs -91.43% in Dec 2024
Annual Results Snapshot (Consolidated) - Mar'26
YoY Growth in year ended Mar 2026 is 10.73% vs -5.99% in Mar 2025
YoY Growth in year ended Mar 2026 is -173.38% vs -25.86% in Mar 2025
About Jain Irrigation Systems Ltd

Company Coordinates


