Jaipan Industrie

  • Market Cap: Micro Cap
  • Industry: Electronics & Appliances
  • ISIN: INE058D01030
  • NSEID:
  • BSEID: 505840
INR
35.75
1 (2.88%)
BSENSE

Sep 25, 03:30 PM

BSE+NSE Vol: 1.64 k

  • Price Points
  • Score
  • Mojo Parameters
  • Total Return
  • News and Corporate Actions
  • Key factors
  • Shareholding
  • Financials
  • CompanyCV
stock-summaryPrice Point
High/Low

1Day

52 Week

Valuation
Technical
Day's Volume

CASH

1.64 k (-18.13%) Volume

Shareholding (Jun 2026)

FII

0.00%

Held by 0 FIIs

DII

0.00%

Held by 0 DIIs

Promoter

35.13%

Why is Jaipan Industries Ltd falling/rising?

06-Sep-2026

As of 05-Sep, Jaipan Industries Ltd's stock price is rising to Rs 40.57, with a 1.43% increase. The stock has significantly outperformed the Sensex over various time frames, although there has been a decline in investor participation.

As of 05-Sep, Jaipan Industries Ltd's stock price is rising, currently at Rs 40.57, reflecting a change of Rs 0.57 or 1.43% increase. This upward movement is supported by several factors. Over the past week, the stock has outperformed the benchmark Sensex, gaining 2.97% while the Sensex declined by 0.97%. In the last month, Jaipan Industries has shown a significant increase of 11.30%, contrasting with a 2.44% drop in the Sensex.<BR><BR>Year-to-date, the stock has risen by 36.37%, while the Sensex has fallen by 10.21%, indicating strong relative performance. Additionally, the stock has consistently traded above its 5-day, 20-day, 50-day, 100-day, and 200-day moving averages, which is a positive technical indicator. On the day of the report, the stock opened with a gain of 2% and reached an intraday high of Rs 41.47, marking a 3.68% increase.<BR><BR>However, it is worth noting that there has been a decline in investor participation, with delivery volume falling by 40.57% compared to the 5-day average. Despite this drop in participation, the overall performance metrics suggest that the stock is on an upward trajectory.

View full answer

Who are in the management team of Jaipan Industrie?

01-Sep-2026

The management team of Jaipan Industrie includes Veena J Agarwal (Chairman & Managing Director), Shirish Gotecha, Ravindra Mishra, Chandrakant Balde (all Non-Executive & Independent Directors), Rakesh Jain (Non-Executive & Non-Independent Director), Munna Lal Babu Lal (Company Secretary & Compliance Officer), and additional directors J N Agarwal and Atin J Agarwal. They are responsible for guiding the company's strategy and operations.

The management team of Jaipan Industrie includes the following individuals:<BR><BR>1. **Veena J Agarwal** - Chairman & Managing Director<BR>2. **Shirish Gotecha** - Non-Executive & Independent Director<BR>3. **Ravindra Mishra** - Non-Executive & Independent Director<BR>4. **Rakesh Jain** - Non-Executive & Non-Independent Director<BR>5. **Chandrakant Balde** - Non-Executive & Independent Director<BR>6. **Munna Lal Babu Lal** - Company Secretary & Compliance Officer<BR>7. **J N Agarwal** - Additional Director<BR>8. **Atin J Agarwal** - Additional Director<BR><BR>This team plays a crucial role in guiding the company's strategy and operations.

View full answer

What does Jaipan Industrie do?

01-Sep-2026

Jaipan Industries Ltd, established in 1965, specializes in the sales and service of electronic household accessories and is classified as a micro-cap company with a market cap of INR 24 Cr. As of June 2026, it reported net sales of 5 Cr and a net profit of 0 Cr.

Overview:<BR>Jaipan Industries Ltd is engaged in the sales and service of electronic household accessories and operates within the Electronics & Appliances industry, classified as a micro-cap company.<BR><BR>History:<BR>Jaipan Industries Ltd was incorporated on April 27, 1965. The latest quarterly results reported are for June 2026, showing net sales and net profit figures.<BR><BR>Financial Snapshot:<BR>Most recent Net Sales: 5 Cr (Quarterly Results - Jun 2026) <BR>Most recent Net Profit: 0 Cr (Quarterly Results - Jun 2026) <BR>Market-cap value: INR 24 Cr (Micro Cap)<BR><BR>Key Metrics:<BR>P/E: 7.00 <BR>Industry P/E: 21 <BR>Dividend Yield: 0.00% <BR>Debt-Equity: 0.69 <BR>Return on Equity: 43.84% <BR>Price to Book: 3.12 <BR><BR>Contact Details:<BR>Address: 17 Cama Industrial Estate, Walbhat Road Goregaon (East) Mumbai Maharashtra : 400063 <BR>Tel: 91-022-56919171-72-73-74-75-76-77-8 <BR>Email: Jaipan1@boom4.vsnl.net.in <BR>Website: http://www.jaipan.com

View full answer

Who are the peers of the Jaipan Industrie?

01-Sep-2026

Jaipan Industrie's peers include Calcom Vision, Khaitan (India), Gothi Plascon, and others, with varying management and growth risks. Khaitan (India) leads in 1-year returns at 50.95%, while Jaipan Industrie has a return of 17.42%.

Peers: The peers of Jaipan Industrie are Calcom Vision, Khaitan (India), Gothi Plascon, Comrade Applian., Gorani Industrie, Dolphin Kitchen, VXL Instruments, Aspire & Innovat, and Five Core Elect.<BR><BR>Quality Snapshot: Below Average management risk is observed at Calcom Vision, Khaitan (India), Comrade Applian., Jaipan Industrie, VXL Instruments, and Aspire & Innovat, while Average management risk is found at Gorani Industrie and Dolphin Kitchen. Good management risk is noted at Gothi Plascon. Growth is Average at Calcom Vision, Jaipan Industrie, Comrade Applian., Gorani Industrie, VXL Instruments, and Aspire & Innovat, while Good growth is seen at Khaitan (India) and Below Average growth is noted at Gothi Plascon and Dolphin Kitchen. Capital Structure is Good at Gothi Plascon and Dolphin Kitchen, Below Average at Calcom Vision, Khaitan (India), Jaipan Industrie, Comrade Applian., Gorani Industrie, VXL Instruments, and Aspire & Innovat, while Five Core Elect. does not qualify.<BR><BR>Return Snapshot: The peer with the highest 1-year return is Khaitan (India) with 50.95%, while the lowest is Dolphin Kitchen with -77.07%. Jaipan Industrie’s 1-year return of 17.42% is better than Dolphin Kitchen but lower than Khaitan (India). Additionally, the six-month returns for Dolphin Kitchen, Gorani Industrie, and VXL Instruments are negative.

View full answer

How big is Jaipan Industrie?

01-Sep-2026

As of 31st August, Jaipan Industries Ltd has a market capitalization of 24.00 Cr, with recent net sales of 26.45 Cr and a net profit of 3.38 Cr. Shareholder's funds are 4.38 Cr, and total assets are valued at 16.52 Cr as of March 2025.

As of 31st August, Jaipan Industries Ltd has a market capitalization of 24.00 Cr, categorizing it as a Micro Cap company.<BR><BR>In the latest four quarters, Jaipan Industries reported Net Sales of 26.45 Cr and a Net Profit of 3.38 Cr.<BR><BR>The latest annual period for the balance sheet is March 2025, with Shareholder's Funds amounting to 4.38 Cr and Total Assets valued at 16.52 Cr.

View full answer

Are Jaipan Industries Ltd latest results good or bad?

16-Jul-2026

Jaipan Industries Ltd's latest Q1 FY27 results show a mixed performance with a 66.67% sequential increase in net profit, but a significant year-on-year sales decline of 14.33% and compressed operating margins indicate ongoing challenges, suggesting caution regarding the company's long-term viability.

Jaipan Industries Ltd's latest results for Q1 FY27 present a mixed picture. On one hand, the company has shown a sequential improvement in net profit, which increased by 66.67% quarter-on-quarter to ₹0.10 crores, and a year-on-year increase of 100% from ₹0.05 crores. However, the absolute profit figure remains quite low, especially considering the company's market capitalization of ₹21 crores, translating to an annualized profit run-rate of only ₹0.40 crores.<BR><BR>Net sales for the quarter were ₹5.20 crores, reflecting a modest growth of 3.79% compared to the previous quarter, but this still represents a significant year-on-year decline of 14.33%. The operating margin has also contracted to 3.85% from 5.19% in the previous quarter, indicating ongoing cost pressures.<BR><BR>While there are signs of stabilization in terms of sequential growth, the overall financial health of the company raises concerns. The persistent decline in year-on-year sales suggests that Jaipan Industries is losing market share in a competitive environment. Additionally, the company's return on capital employed (ROCE) remains deeply negative on average, and its financial metrics indicate significant challenges in capital efficiency.<BR><BR>In summary, while there are some positive sequential trends, the underlying fundamentals of Jaipan Industries Ltd remain weak, with declining revenues and compressed margins. This suggests that the latest results are not entirely good, and caution is warranted regarding the company's long-term viability.

View full answer

Should I buy, sell or hold Jaipan Industries Ltd?

16-Jul-2026

When is the next results date for Jaipan Industries Ltd?

08-Jul-2026

The next results date for Jaipan Industries Ltd is 15 July 2026.

The next results date for Jaipan Industries Ltd is scheduled for 15 July 2026.

View full answer

Is Jaipan Industrie overvalued or undervalued?

05-Dec-2025

As of December 4, 2025, Jaipan Industries is fairly valued with a PE ratio of 5.14 and strong growth potential, despite a year-to-date return of -27.69%, compared to the Sensex's 9.12%, and a solid ROE of 43.50%.

As of 4 December 2025, Jaipan Industrie has moved from an attractive to a fair valuation grade. The company is currently fairly valued based on its financial metrics. Key ratios include a PE ratio of 5.14, an EV to EBITDA of 19.16, and a PEG ratio of 0.04, indicating strong earnings growth potential relative to its price.<BR><BR>When compared to peers, Jaipan's valuation stands out. For instance, PTC India, which is considered very attractive, has a PE ratio of 7.18, while Elitecon International is deemed very expensive with a PE ratio of 197.4. Despite recent stock performance lagging behind the Sensex, especially with a year-to-date return of -27.69% compared to the Sensex's 9.12%, the company's solid ROE of 43.50% suggests it has the potential for future growth, reinforcing its fair valuation status.

View full answer

How has been the historical performance of Jaipan Industrie?

14-Nov-2025

Jaipan Industrie experienced significant fluctuations in financial performance, with a recovery in 2025 showing net sales of 28.74 Cr and a profit after tax of 0.24 Cr, up from losses in 2024. However, total assets and reserves have decreased, indicating ongoing financial stability concerns.

Answer:<BR>The historical performance of Jaipan Industrie shows significant fluctuations in key financial metrics over the years.<BR><BR>Breakdown:<BR>Jaipan Industrie reported net sales of 28.74 Cr in March 2025, an increase from 22.52 Cr in March 2024, but a decline from 39.15 Cr in March 2023. The total operating income followed a similar trend, reaching 28.74 Cr in March 2025, up from 22.52 Cr in the previous year, yet down from 39.15 Cr in March 2023. The company's total expenditure, excluding depreciation, was 27.82 Cr in March 2025, a decrease from 33.30 Cr in March 2024 and 38.19 Cr in March 2023. Operating profit, excluding other income, was 0.92 Cr in March 2025, recovering from a loss of 10.78 Cr in March 2024, while profit before tax stood at 0.24 Cr in March 2025, compared to a loss of 11.35 Cr in the previous year. The profit after tax also improved to 0.24 Cr in March 2025 from a loss of 11.35 Cr in March 2024. The earnings per share (EPS) was 0.39 in March 2025, a recovery from a negative EPS of -18.61 in March 2024. Total assets decreased to 16.52 Cr in March 2025 from 18.37 Cr in March 2024, while total liabilities also fell to 16.52 Cr from 18.37 Cr in the previous year. The company maintained a consistent share capital of 6.10 Cr over the years, with reserves dropping significantly to 4.38 Cr in March 2025 from 9.39 Cr in March 2023. Overall, Jaipan Industrie has shown signs of recovery in 2025 after a challenging 2024, but its financial stability remains a concern given the volatility in its performance metrics.

View full answer

What is the technical trend for Jaipan Industrie?

09-Jun-2025

As of June 2, 2025, Jaipan Industrie shows a mildly bearish trend overall, with conflicting signals across time frames, as the weekly MACD and KST are bullish while the monthly indicators lean bearish.

As of 2 June 2025, the technical trend for Jaipan Industrie has changed from mildly bullish to mildly bearish. The weekly MACD remains bullish, but the monthly MACD indicates a mildly bearish stance. The daily moving averages are also showing a mildly bearish trend. Bollinger Bands are mildly bullish on the weekly chart but bearish on the monthly. The KST is bullish weekly but mildly bearish monthly. Overall, the indicators suggest a mildly bearish stance with some conflicting signals across different time frames, particularly between the weekly and monthly perspectives.

View full answer

Who are the top shareholders of the Jaipan Industrie?

06-Jun-2025

The top shareholders of Jaipan Industrie are Jainarain O Agarwal with 29.13%, and Parthiv Rameshchandra Patel with 5%. Individual investors collectively own 52.36%, with no institutional holdings reported.

The top shareholders of Jaipan Industrie include Jainarain O Agarwal, who holds the largest stake at 29.13%. Following him, the highest public shareholder is Parthiv Rameshchandra Patel, with a holding of 5%. Additionally, individual investors collectively own 52.36% of the company. There are no institutional holdings from mutual funds or foreign institutional investors.

View full answer

Has Jaipan Industrie declared dividend?

06-Jun-2025

No Dividend History Available

iScoreScore

Dashboard

1

Weak Long Term Fundamental Strength with an average Return on Capital Employed (ROCE) of 3.49%

  • Poor long term growth as Net Sales has grown by an annual rate of 9.46% and Operating profit at 8.59% over the last 5 years
  • Low ability to service debt as the company has a high Debt to EBITDA ratio of 7.15 times
2

Flat results in Jun 26

3

With ROCE of 5, it has a Expensive valuation with a 2.1 Enterprise value to Capital Employed

4

Reducing Promoter Confidence

stock-summaryMojo Parameters

Mojo Parameters

Loading Valuation Snapshot...

Stock DNA

stock-summary
Industry

Electronics & Appliances

stock-summary
Market cap

INR 21 Cr (Micro Cap)

stock-summary
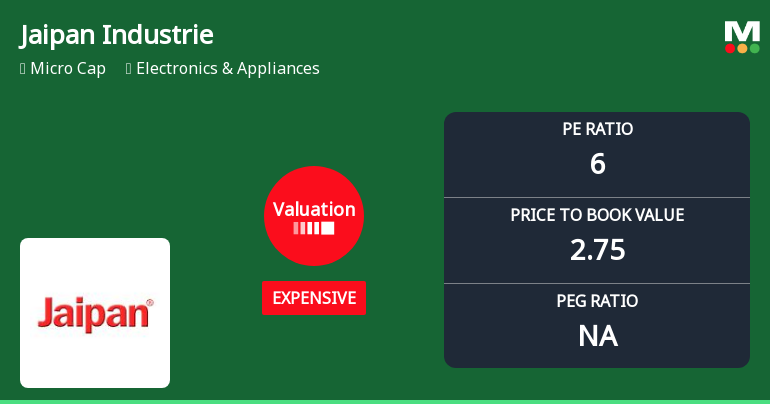
P/E

6.00

stock-summary
Industry P/E

22

stock-summary
Dividend Yield

0.00%

stock-summary
Debt Equity

0.69

stock-summary
Return on Equity

43.84%

stock-summary
Price to Book

2.75

Revenue and Profits:
Net Sales:
5 Cr
(Quarterly Results - Jun 2026)
Net Profit:
0 Cr
stock-summaryTotal Returns
Total Returns (Price + Dividend) stock-summary
Dividend Yield (0%)
TimePeriod
Price Return
Dividend Return
Total Return
3 Months
27.68%
0%
27.68%
6 Months
29.95%
0%
29.95%
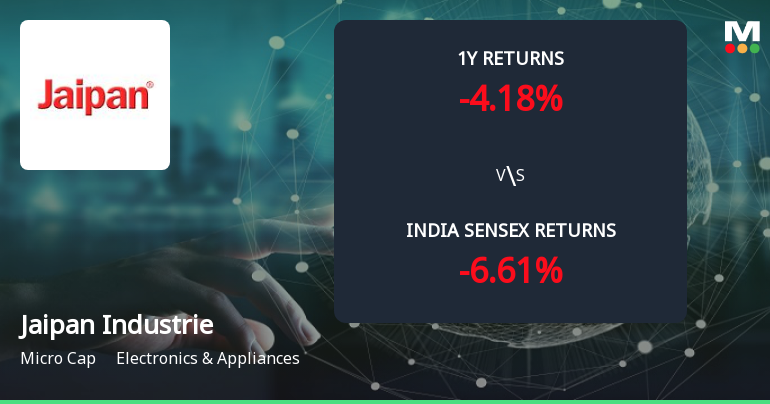
1 Year
12.56%
0%
12.56%
2 Years
2.14%
0%
2.14%
3 Years
-13.44%
0%
-13.44%
4 Years
2.88%
0%
2.88%
5 Years
287.32%
0%
287.32%

Jaipan Industrie for the last several years.

Risk Adjusted Returns v/s stock-summary
Returns Beta
Icon
Beta has not been calculated since enough price history is not available
stock-summaryNews & Corporate Actions

News

Announcements stock-summary

Board Meeting Outcome for 1) The Annual General Meeting Will Be Going To Held On 30Th September 2026 2) Approve Director Report For The Period Ended 31/03/2026 3) Remote Voting Period Start From 27Th September 2026 At 09.00 And Ends On 29Th September 202

06-Sep-2026 | Source : BSE

a) The Annual General Meeting will be going to held on 30th September 2026

Closure of Trading Window

06-Sep-2026 | Source : BSE

The Register of members and Share transfer books shall remain closed from Saturday 26th September 2026 to Wednesday 30th September 2026 both inclusive

Annual General Meeting Of Members Will Be Held On 30Th September 2026 @ 9.30 A.M. @ Registered Place Of The Company

06-Sep-2026 | Source : BSE

Notice Convening the 60th Annual General Meeting Scheduled tot be held on Wednesday 30th September 2026 9.30 A.M. and Physiccal mode at Jai Villa Compound Cama Industrial Estate Walbhatt Road Goregaon East Mumbai 400063

Corporate Actions stock-summary

stock-summary
BOARD MEETING

No Upcoming Board Meetings

stock-summary
DIVIDEND

No Dividend history available

stock-summary
SPLITS

No Splits history available

stock-summary
BONUS

No Bonus history available

stock-summary
RIGHTS

No Rights history available

stock-summaryKey Factors

Quality key factors stock-summary

Factor
Value
Sales Growth (5y)
9.46%
EBIT Growth (5y)
8.59%
EBIT to Interest (avg)
-1.68
Debt to EBITDA (avg)
4.13
Net Debt to Equity (avg)
0.69
Sales to Capital Employed (avg)
1.74
Tax Ratio
0
Dividend Payout Ratio
0
Pledged Shares
0
Institutional Holding
0
ROCE (avg)
-21.79%
ROE (avg)
12.24%

Valuation key factors

Factor
Value
P/E Ratio
6
Industry P/E
22
Price to Book Value
2.83
EV to EBIT
27.16
EV to EBITDA
27.16
EV to Capital Employed
2.08
EV to Sales
1.03
PEG Ratio
NA
Dividend Yield
NA
ROCE (Latest)
4.98%
ROE (Latest)
43.84%

Technicals key factors

Indicator
Weekly
Monthly
MACD
Bullish
Bullish
RSI
No Signal
No Signal
Bollinger Bands
Mildly Bullish
Mildly Bullish
Moving Averages
Mildly Bullish (Daily)
KST
Bullish
Mildly Bullish
Dow Theory
Mildly Bearish
Mildly Bullish
stock-summary Technical Indicator Scale: Bearish, Mildly Bearish, Sideways, Mildly Bullish, Bullish  Turned 
stock-summaryShareholding
Shareholding Snapshot : Jun 2026stock-summary
Shareholding Compare (%holding) stock-summary
Majority shareholders

Non Institution

Pledged Promoter Holdings

None

Mutual Funds

Held by 0 Schemes

FIIs

Held by 0 FIIs

Promoter with highest holding

Jainarain O Agarwal (28.15%)

Highest Public shareholder

Parthiv Rameshchandra Patel (5%)

Individual Investors Holdings

56.62%

stock-summaryFinancial
[
  {
    "link": "quarterly",
    "btn_text": "All Quarterly Results",
    "header": "Quarterly Results Snapshot (Standalone) - Jun'26 - QoQ",
    "rhs": [
      {
        "prefix": "Net Sales ",
        "suffix": "QoQ Growth in quarter ended Jun 2026 is 3.79% vs -43.07% in Mar 2026",
        "dir": 1
      },
      {
        "prefix": "Standalone Net Profit ",
        "suffix": "QoQ Growth in quarter ended Jun 2026 is 66.67% vs -45.45% in Mar 2026",
        "dir": 1
      }
    ],
    "table": {
      "header": [
        "Jun'26",
        "Mar'26",
        "Change(%)"
      ],
      "body": [
        {
          "field": "Net Sales",
          "val1": "5.20",
          "val2": "5.01",
          "chgp": "3.79%",
          "chgp_class": "positive"
        },
        {
          "field": "Operating Profit (PBDIT) excl Other Income",
          "val1": "0.20",
          "val2": "0.26",
          "chgp": "-23.08%",
          "chgp_class": "negative"
        },
        {
          "field": "Interest",
          "val1": "0.08",
          "val2": "0.12",
          "chgp": "-33.33%",
          "chgp_class": "positive"
        },
        {
          "field": "Exceptional Items",
          "val1": "0.00",
          "val2": "0.00",
          "chgp": "",
          "chgp_class": "neutral"
        },
        {
          "field": "Standalone Net Profit",
          "val1": "0.10",
          "val2": "0.06",
          "chgp": "66.67%",
          "chgp_class": "positive"
        },
        {
          "field": "Operating Profit Margin (Excl OI)",
          "val1": "3.85%",
          "val2": "5.19%",
          "chgp": "-1.34%",
          "chgp_class": "negative"
        }
      ]
    }
  },
  {
    "link": "half-yearly",
    "btn_text": "All Half Yearly Results",
    "header": "Half Yearly Results Snapshot (Standalone) - Sep'25",
    "rhs": [
      {
        "prefix": "Net Sales ",
        "suffix": " Growth in half year ended Sep 2025 is -1.96% vs 48.54% in Sep 2024",
        "dir": -1
      },
      {
        "prefix": "Standalone Net Profit ",
        "suffix": " Growth in half year ended Sep 2025 is 2,533.33% vs 119.05% in Sep 2024",
        "dir": 1
      }
    ],
    "table": {
      "header": [
        "Sep'25",
        "Sep'24",
        "Change(%)"
      ],
      "body": [
        {
          "field": "Net Sales",
          "val1": "13.50",
          "val2": "13.77",
          "chgp": "-1.96%",
          "chgp_class": "negative"
        },
        {
          "field": "Operating Profit (PBDIT) excl Other Income",
          "val1": "0.37",
          "val2": "0.36",
          "chgp": "2.78%",
          "chgp_class": "positive"
        },
        {
          "field": "Interest",
          "val1": "0.16",
          "val2": "0.22",
          "chgp": "-27.27%",
          "chgp_class": "positive"
        },
        {
          "field": "Exceptional Items",
          "val1": "0.00",
          "val2": "0.00",
          "chgp": "",
          "chgp_class": "neutral"
        },
        {
          "field": "Standalone Net Profit",
          "val1": "3.16",
          "val2": "0.12",
          "chgp": "2,533.33%",
          "chgp_class": "positive"
        },
        {
          "field": "Operating Profit Margin (Excl OI)",
          "val1": "2.74%",
          "val2": "2.61%",
          "chgp": "0.13%",
          "chgp_class": "positive"
        }
      ]
    }
  },
  {
    "link": "nine-monthly",
    "btn_text": "All Nine Monthly Results",
    "header": "Nine Monthly Results Snapshot (Standalone) - Dec'25",
    "rhs": [
      {
        "prefix": "Net Sales ",
        "suffix": "YoY Growth in nine months ended Dec 2025 is 2.86% vs 42.63% in Dec 2024",
        "dir": -1
      },
      {
        "prefix": "Standalone Net Profit ",
        "suffix": "YoY Growth in nine months ended Dec 2025 is 1,823.53% vs 117.17% in Dec 2024",
        "dir": 1
      }
    ],
    "table": {
      "header": [
        "Dec'25",
        "Dec'24",
        "Change(%)"
      ],
      "body": [
        {
          "field": "Net Sales",
          "val1": "22.30",
          "val2": "21.68",
          "chgp": "2.86%",
          "chgp_class": "positive"
        },
        {
          "field": "Operating Profit (PBDIT) excl Other Income",
          "val1": "0.60",
          "val2": "0.52",
          "chgp": "15.38%",
          "chgp_class": "positive"
        },
        {
          "field": "Interest",
          "val1": "0.23",
          "val2": "0.34",
          "chgp": "-32.35%",
          "chgp_class": "positive"
        },
        {
          "field": "Exceptional Items",
          "val1": "0.00",
          "val2": "0.00",
          "chgp": "",
          "chgp_class": "neutral"
        },
        {
          "field": "Standalone Net Profit",
          "val1": "3.27",
          "val2": "0.17",
          "chgp": "1,823.53%",
          "chgp_class": "positive"
        },
        {
          "field": "Operating Profit Margin (Excl OI)",
          "val1": "2.69%",
          "val2": "2.40%",
          "chgp": "0.29%",
          "chgp_class": "positive"
        }
      ]
    }
  },
  {
    "link": "annual",
    "btn_text": "All Annual Results",
    "header": "Annual Results Snapshot (Standalone) - Mar'26",
    "rhs": [
      {
        "prefix": "Net Sales ",
        "suffix": "YoY Growth in year ended Mar 2026 is -4.98% vs 27.62% in Mar 2025",
        "dir": -1
      },
      {
        "prefix": "Standalone Net Profit ",
        "suffix": "YoY Growth in year ended Mar 2026 is 1,287.50% vs 102.11% in Mar 2025",
        "dir": 1
      }
    ],
    "table": {
      "header": [
        "Mar'26",
        "Mar'25",
        "Change(%)"
      ],
      "body": [
        {
          "field": "Net Sales",
          "val1": "27.31",
          "val2": "28.74",
          "chgp": "-4.98%",
          "chgp_class": "negative"
        },
        {
          "field": "Operating Profit (PBDIT) excl Other Income",
          "val1": "0.85",
          "val2": "0.92",
          "chgp": "-7.61%",
          "chgp_class": "negative"
        },
        {
          "field": "Interest",
          "val1": "0.35",
          "val2": "0.50",
          "chgp": "-30.00%",
          "chgp_class": "positive"
        },
        {
          "field": "Exceptional Items",
          "val1": "3.00",
          "val2": "0.00",
          "chgp": "",
          "chgp_class": "neutral"
        },
        {
          "field": "Standalone Net Profit",
          "val1": "3.33",
          "val2": "0.24",
          "chgp": "1,287.50%",
          "chgp_class": "positive"
        },
        {
          "field": "Operating Profit Margin (Excl OI)",
          "val1": "3.11%",
          "val2": "3.20%",
          "chgp": "-0.09%",
          "chgp_class": "negative"
        }
      ]
    }
  }
]

Quarterly Results Snapshot (Standalone) - Jun'26 - QoQstock-summary

Jun'26
Mar'26
Change(%)
Net Sales
5.20
5.01
3.79%
Operating Profit (PBDIT) excl Other Income
0.20
0.26
-23.08%
Interest
0.08
0.12
-33.33%
Exceptional Items
0.00
0.00
Standalone Net Profit
0.10
0.06
66.67%
Operating Profit Margin (Excl OI)
3.85%
5.19%
-1.34%
Values in Rs Cr.
Direction Arrows
Net Sales

QoQ Growth in quarter ended Jun 2026 is 3.79% vs -43.07% in Mar 2026

Direction Arrows
Standalone Net Profit

QoQ Growth in quarter ended Jun 2026 is 66.67% vs -45.45% in Mar 2026

Half Yearly Results Snapshot (Standalone) - Sep'25stock-summary

Sep'25
Sep'24
Change(%)
Net Sales
13.50
13.77
-1.96%
Operating Profit (PBDIT) excl Other Income
0.37
0.36
2.78%
Interest
0.16
0.22
-27.27%
Exceptional Items
0.00
0.00
Standalone Net Profit
3.16
0.12
2,533.33%
Operating Profit Margin (Excl OI)
2.74%
2.61%
0.13%
Values in Rs Cr.
Direction Arrows
Net Sales

Growth in half year ended Sep 2025 is -1.96% vs 48.54% in Sep 2024

Direction Arrows
Standalone Net Profit

Growth in half year ended Sep 2025 is 2,533.33% vs 119.05% in Sep 2024

Nine Monthly Results Snapshot (Standalone) - Dec'25stock-summary

Dec'25
Dec'24
Change(%)
Net Sales
22.30
21.68
2.86%
Operating Profit (PBDIT) excl Other Income
0.60
0.52
15.38%
Interest
0.23
0.34
-32.35%
Exceptional Items
0.00
0.00
Standalone Net Profit
3.27
0.17
1,823.53%
Operating Profit Margin (Excl OI)
2.69%
2.40%
0.29%
Values in Rs Cr.
Direction Arrows
Net Sales

YoY Growth in nine months ended Dec 2025 is 2.86% vs 42.63% in Dec 2024

Direction Arrows
Standalone Net Profit

YoY Growth in nine months ended Dec 2025 is 1,823.53% vs 117.17% in Dec 2024

Annual Results Snapshot (Standalone) - Mar'26stock-summary

Mar'26
Mar'25
Change(%)
Net Sales
27.31
28.74
-4.98%
Operating Profit (PBDIT) excl Other Income
0.85
0.92
-7.61%
Interest
0.35
0.50
-30.00%
Exceptional Items
3.00
0.00
Standalone Net Profit
3.33
0.24
1,287.50%
Operating Profit Margin (Excl OI)
3.11%
3.20%
-0.09%
Values in Rs Cr.
Direction Arrows
Net Sales

YoY Growth in year ended Mar 2026 is -4.98% vs 27.62% in Mar 2025

Direction Arrows
Standalone Net Profit

YoY Growth in year ended Mar 2026 is 1,287.50% vs 102.11% in Mar 2025

stock-summaryCompany CV
About Jaipan Industries Ltd stock-summary
stock-summary
Jaipan Industries Ltd
Micro Cap
Electronics & Appliances
Jaipan Industries Ltd. was incorporated on April 27, 1965. The Company is in the business of sales and service of Electronic Household Accessories. It has a worldwide network, single sales office, a warehouse and a workforce of over 50 people that sell a single product to about 1,00,000 + customers in India and Abroad. In 2007, the Company launched new models of Mixer Grinders, OvenToaster-Griller, Sandwich Toasters, Geysers, Non-Stick Products and new model of Washing Machine.
Company Coordinates stock-summary
Company Details
17 Cama Industrial Estate, Walbhat Road Goregaon (East) Mumbai Maharashtra : 400063
stock-summary
Tel: 91-022-56919171-72-73-74-75-76-77-8
stock-summary
Jaipan1@boom4.vsnl.net.in
Registrar Details
Link Intime India Pvt Ltd, C-13 Pannalal Silk Compound, L B S Marg, Bhandup , Mumbai
Footer loading