
Compare JP Power Ven. with Similar Stocks
Dashboard
Poor Management Efficiency with a low ROCE of 7.29%
- The company has been able to generate a Return on Capital Employed (avg) of 7.29% signifying low profitability per unit of total capital (equity and debt)
Poor long term growth as Operating profit has grown by an annual rate 3.84% of over the last 5 years
Negative results in Mar 26
With ROCE of 6.3, it has a Attractive valuation with a 1 Enterprise value to Capital Employed
79.2% of Promoter Shares are Pledged
Market Beating performance in long term as well as near term
Total Returns (Price + Dividend) 
Latest dividend: 0.0700 per share ex-dividend date: Aug-10-2009
Risk Adjusted Returns v/s
Returns Beta

News

Jaiprakash Power Ventures Ltd Sees Exceptional Volume Amid Mixed Price Action
Jaiprakash Power Ventures Ltd (JPPOWER) emerged as one of the most actively traded stocks on 23 June 2026, registering a remarkable volume surge that highlights growing investor interest despite a slight dip in price. The stock’s trading activity and technical signals suggest a nuanced market sentiment, with accumulation and distribution patterns warranting close attention from investors and analysts alike.
Read full news article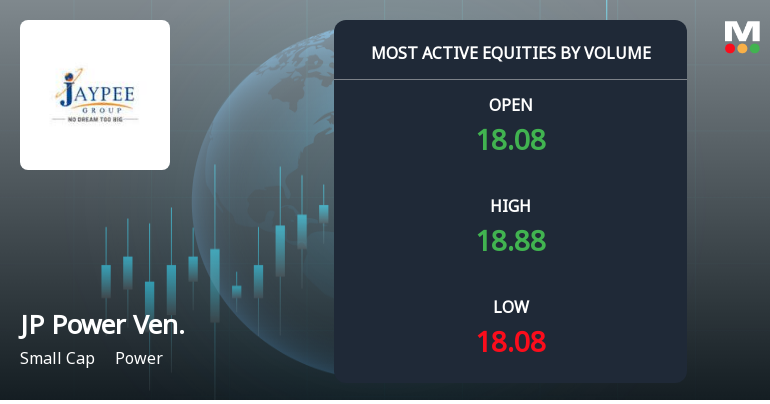
Jaiprakash Power Ventures Ltd Sees Exceptional Volume Surge Amid Hold Rating Upgrade
Jaiprakash Power Ventures Ltd (JPPOWER) emerged as one of the most actively traded stocks on 22 June 2026, registering a significant surge in volume alongside a recent upgrade in its Mojo Grade from Sell to Hold. The power sector small-cap stock demonstrated resilience by outperforming its sector and the broader Sensex, signalling renewed investor interest despite some mixed technical signals.
Read full news article
Jaiprakash Power Ventures Ltd is Rated Hold by MarketsMOJO
Jaiprakash Power Ventures Ltd is rated 'Hold' by MarketsMOJO, with this rating last updated on 26 May 2026. While the rating change occurred on that date, the analysis and financial metrics presented here reflect the stock's current position as of 19 June 2026, providing investors with an up-to-date view of the company’s fundamentals, returns, and market standing.
Read full news article Announcements
Jaiprakash Power Ventures Limited - Cessation
09-Dec-2019 | Source : NSEJaiprakash Power Ventures Limited has informed the Exchange regarding Cessation of Mr M K V Ramarao as Executive Director of the company w.e.f. December 09, 2019.
Jaiprakash Power Ventures Limited - Outcome of Board Meeting
01-Nov-2019 | Source : NSEJaiprakash Power Ventures Limited has informed the Exchange regarding Board meeting held on October 30, 2019.
Jaiprakash Power Ventures Limited - Appointment
17-Oct-2019 | Source : NSEJaiprakash Power Ventures Limited has informed the Exchange regarding Appointment of Mr Jagmohan Garg as Non- Executive Independent Director of the company w.e.f. October 16, 2019.
Corporate Actions

No Upcoming Board Meetings

Jaiprakash Power Ventures Ltd has declared 8% dividend, ex-date: 10 Aug 09

No Splits history available

No Bonus history available

No Rights history available
Quality key factors
Valuation key factors
Technicals key factors
 Technical Indicator Scale: Bearish, Mildly Bearish, Sideways, Mildly Bullish, Bullish Turned
 Shareholding Snapshot : Mar 2026
Shareholding Compare (%holding)
Non Institution
79.1995
Held by 16 Schemes (0.41%)
Held by 96 FIIs (6.59%)
Jaiprakash Associates Limited (24.0%)
Icici Bank Ltd (9.97%)
40.71%
Quarterly Results Snapshot (Consolidated) - Mar'26 - QoQ

QoQ Growth in quarter ended Mar 2026 is 19.98% vs -19.66% in Dec 2025

QoQ Growth in quarter ended Mar 2026 is -454.64% vs -97.93% in Dec 2025
Half Yearly Results Snapshot (Consolidated) - Sep'25
Growth in half year ended Sep 2025 is 1.35% vs -2.50% in Sep 2024
Growth in half year ended Sep 2025 is -13.36% vs 104.06% in Sep 2024
Nine Monthly Results Snapshot (Consolidated) - Dec'25
YoY Growth in nine months ended Dec 2025 is 1.35% vs -21.47% in Dec 2024
YoY Growth in nine months ended Dec 2025 is -29.47% vs 51.88% in Dec 2024
Annual Results Snapshot (Consolidated) - Mar'26
YoY Growth in year ended Mar 2026 is 1.85% vs -19.23% in Mar 2025
YoY Growth in year ended Mar 2026 is -44.61% vs -20.39% in Mar 2025
About Jaiprakash Power Ventures Ltd

Company Coordinates


