Jasch Industries

  • Market Cap: Micro Cap
  • Industry: Garments & Apparels
  • ISIN: INE711C01028
  • NSEID:
  • BSEID: 500220
INR
301.00
-2.05 (-0.68%)
BSENSE

Aug 12, 02:33 PM

BSE+NSE Vol: 3.95 k

  • Price Points
  • Score
  • Mojo Parameters
  • Total Return
  • News and Corporate Actions
  • Key factors
  • Shareholding
  • Financials
  • CompanyCV
stock-summaryPrice Point
High/Low

1Day

52 Week

Valuation
Technical
Day's Volume

CASH

3.95 k (-14.07%) Volume

Shareholding (Jun 2026)

FII

0.00%

Held by 0 FIIs

DII

0.00%

Held by 0 DIIs

Promoter

57.64%

Why is Jasch Industries Ltd falling/rising?

12-Aug-2026

As of 11-Aug, Jasch Industries Ltd's stock price is 303.05, reflecting a 3.98% increase and strong performance with an 89.35% rise year-to-date. Despite a decline in investor participation, the stock shows positive momentum and is trading above its moving averages.

As of 11-Aug, Jasch Industries Ltd is experiencing a rise in its stock price, currently at 303.05, with a change of 11.6 (3.98%) upward. The stock has shown strong performance over various periods, including a 2.43% increase over the past week and an impressive 89.35% rise year-to-date, significantly outperforming the Sensex, which has declined by 8.29% in the same timeframe.<BR><BR>Today, the stock opened with a gain of 4.65% and reached an intraday high of Rs 306, reflecting positive momentum. Additionally, it has outperformed its sector by 5.21% today and has been on a consecutive gain streak for the last two days, accumulating a total return of 8.66% in this period. Furthermore, Jasch Industries is trading above its moving averages across multiple timeframes, indicating a strong upward trend.<BR><BR>However, it is important to note that there has been a decline in investor participation, with delivery volume falling by 43.23% compared to the 5-day average. Despite this, the stock remains liquid enough for trading, which suggests that the overall positive performance and upward price movement are driving the stock's rise.

View full answer

Should I buy, sell or hold Jasch Industries Ltd?

01-Aug-2026

When is the next results date for Jasch Industries Ltd?

21-Jul-2026

The next results date for Jasch Industries Ltd is 30 July 2026.

The next results date for Jasch Industries Ltd is scheduled for 30 July 2026.

View full answer

How big is Jasch Industries?

11-Jun-2026

As of 10th June, Jasch Industries Ltd has a market capitalization of 159.00 Cr, classifying it as a Micro Cap company, with recent Net Sales of 226.77 Cr and a Net Profit of 22.52 Cr.

As of 10th June, Jasch Industries Ltd has a market capitalization of 159.00 Cr, which classifies it as a Micro Cap company.<BR><BR>In the latest four quarters, Jasch Industries reported Net Sales of 226.77 Cr and a Net Profit of 22.52 Cr.<BR><BR>The latest annual period for the balance sheet is March 2023, with Shareholder's Funds amounting to 109.88 Cr and Total Assets of 153.85 Cr.

View full answer

Who are in the management team of Jasch Industries?

11-Jun-2026

The management team of Jasch Industries includes J K Garg (Chairman & Managing Director), Manish Garg, Ramnik Garg, and Navneet Garg (Executive Directors), along with S K Verma (Vice President & Company Secretary) and several Non-Executive & Independent Directors: Kuldeep Singal, Krishan Lall Khetarpaul, Naresh Kumar, and Neetu. They are responsible for the company's strategic direction and operations.

The management team of Jasch Industries includes the following key members:<BR><BR>1. **J K Garg** - Chairman & Managing Director<BR>2. **Manish Garg** - Executive Director<BR>3. **Ramnik Garg** - Executive Director<BR>4. **Navneet Garg** - Executive Director<BR>5. **S K Verma** - Vice President & Company Secretary<BR>6. **Kuldeep Singal** - Non-Executive & Independent Director<BR>7. **Krishan Lall Khetarpaul** - Non-Executive & Independent Director<BR>8. **Naresh Kumar** - Non-Executive & Independent Director<BR>9. **Neetu** - Non-Executive & Independent Director<BR><BR>This team plays a crucial role in guiding the company's strategic direction and operations.

View full answer

Who are the peers of the Jasch Industries?

11-Jun-2026

Jasch Industries' peers include Sh. Dinesh Mills, Indian Terrain, Shri Techtex, S D Retail, Avi Ansh, N R Vandana, and Lagnam Spintex. Jasch Industries has the highest 1-year return at 8.17%, while Indian Terrain has the lowest at -21.98%.

Peers: The peers of Jasch Industries are Sh. Dinesh Mills, Indian Terrain, Shri Techtex, S D Retail, Avi Ansh, N R Vandana, and Lagnam Spintex.<BR><BR>Quality Snapshot: Excellent management risk is observed at Jasch Industries and Shri Techtex, while Good management risk is found at N R Vandana. Average management risk is noted at Sh. Dinesh Mills, Indian Terrain, S D Retail, and Lagnam Spintex, and Below Average management risk is present at Avi Ansh. Growth is Below Average for Jasch Industries, Sh. Dinesh Mills, Indian Terrain, Shri Techtex, S D Retail, and Lagnam Spintex, while Good growth is seen at N R Vandana and Avi Ansh. Capital Structure is Excellent at Jasch Industries and Shri Techtex, Good at Sh. Dinesh Mills and S D Retail, and Below Average at Indian Terrain, Avi Ansh, N R Vandana, and Lagnam Spintex.<BR><BR>Return Snapshot: The peer with the highest 1-year return is Jasch Industries at 8.17%, while Indian Terrain has the lowest at -21.98%. Jasch Industries' 1-year return is significantly higher than that of Indian Terrain. Additionally, Indian Terrain has a negative six-month return of -10.15%.

View full answer

What does Jasch Industries do?

10-Jun-2026

Jasch Industries Ltd is a micro-cap company in the Garments & Apparels industry, specializing in PU Resins and PVC/PU Coated Fabrics. As of March 2026, it reported net sales of 78 Cr and a net profit of 6 Cr, with a market cap of INR 159 Cr.

Overview:<BR>Jasch Industries Ltd is a micro-cap company operating in the Garments & Apparels industry, specializing in the manufacture of PU Resins, PVC/PU Coated Fabrics, and thickness gauging systems.<BR><BR>History:<BR>Jasch Industries Limited was established in December 1985. The latest quarterly results reported net sales and net profit for the period ending March 2026.<BR><BR>Financial Snapshot:<BR>Net Sales: 78 Cr (Quarterly Results - Mar 2026) <BR>Net Profit: 6 Cr (Quarterly Results - Mar 2026) <BR>Market Cap: INR 159 Cr (Micro Cap)<BR><BR>Key Metrics:<BR>P/E: 7.00 <BR>Industry P/E: 23 <BR>Dividend Yield: 0.00% <BR>Debt-Equity: 0.45 <BR>Return on Equity: 19.65% <BR>Price to Book: 2.31 <BR><BR>Contact Details:<BR>Address: 43/5 Bahalgarh Road, Bahalgarh P O Sonepat Haryana : 131021 <BR>Tel: 91-130-3053600 <BR>Email: skverma@jasch.biz <BR>Website: http://www.jaschindustries.com

View full answer

Are Jasch Industries Ltd latest results good or bad?

29-Jan-2026

Jasch Industries Ltd's latest Q3 FY26 results are unfavorable, showing a 6.38% increase in net sales but a significant 26.84% decline in net profit due to rising employee costs and shrinking operating margins. This raises concerns about the company's cost management and profitability.

Jasch Industries Ltd's latest results for Q3 FY26 indicate a mixed performance, leaning towards the negative side. While the company achieved a net sales growth of 6.38% quarter-over-quarter, reaching ₹59.32 crores, the net profit saw a significant decline of 26.84%, dropping to ₹5.07 crores. This sharp decrease in profitability is concerning, especially given the substantial 76.03% increase in employee costs, which rose from ₹4.49 crores in the previous quarter to ₹7.90 crores.<BR><BR>Operating margins also contracted sharply, falling to 11.46% from 17.32% in the prior quarter, indicating challenges in maintaining operational efficiency. The PAT margin similarly decreased, reflecting difficulties in converting revenue growth into profit. <BR><BR>Overall, while the revenue growth suggests some demand stability, the dramatic rise in costs and the resulting impact on profitability raise significant concerns about the company's operational management and cost control. Therefore, the latest results can be viewed as unfavorable, highlighting the need for management to address these cost issues to restore profitability and investor confidence.

View full answer

Is Jasch Industries overvalued or undervalued?

28-Nov-2025

As of November 27, 2025, Jasch Industries is considered very attractive and undervalued with a PE ratio of 12.79, an EV to EBITDA of 9.20, and a PEG ratio of 0.77, especially when compared to peers like K P R Mill Ltd and Trident, despite a year-to-date return of -14.47% against the Sensex.

As of 27 November 2025, the valuation grade for Jasch Industries has moved from attractive to very attractive, indicating a significant improvement in its perceived value. The company is currently considered undervalued. Key ratios supporting this assessment include a PE ratio of 12.79, an EV to EBITDA of 9.20, and a PEG ratio of 0.77, all of which suggest that the stock is trading at a discount relative to its earnings growth potential.<BR><BR>In comparison to its peers, Jasch Industries stands out favorably; for instance, K P R Mill Ltd is classified as very expensive with a PE ratio of 44.12, while Trident, which is attractive, has a PE ratio of 32.38. This peer comparison underscores Jasch's valuation as compelling within the garments and apparels industry. Notably, despite recent underperformance against the Sensex, with a year-to-date return of -14.47% compared to the Sensex's 9.70%, the long-term performance remains strong, with a 5-year return of 377.94%.

View full answer

How has been the historical performance of Jasch Industries?

06-Nov-2025

Jasch Industries has demonstrated steady growth in net sales and profits, with net sales increasing to 233.52 Cr in March 2023 from 214.28 Cr in March 2022. Despite rising costs, the company maintained a stable operating profit margin and improved cash flow from operating activities.

Answer:<BR>The historical performance of Jasch Industries shows a steady growth in net sales and profits over the years, with some fluctuations in margins and costs.<BR><BR>Breakdown:<BR>Jasch Industries reported net sales of 233.52 Cr in March 2023, an increase from 214.28 Cr in March 2022, and significantly higher than 132.64 Cr in March 2020. The total operating income mirrored this trend, reaching 233.52 Cr in March 2023. Raw material costs rose to 158.57 Cr in March 2023 from 146.81 Cr in March 2022, while total expenditure also increased to 205.85 Cr from 185.33 Cr in the previous year. Operating profit (PBDIT) was 31.10 Cr in March 2023, slightly up from 30.75 Cr in March 2022, reflecting a stable operating profit margin of 11.85%. Profit before tax was reported at 26.97 Cr, with a profit after tax of 19.94 Cr in March 2023, down from 20.24 Cr in March 2022. The company's total assets increased to 153.85 Cr in March 2023 from 133.97 Cr in March 2022, while total liabilities also rose to 153.85 Cr from 133.97 Cr. Cash flow from operating activities improved to 6.00 Cr in March 2023, compared to 2.00 Cr in March 2022, indicating better cash generation capabilities. Overall, Jasch Industries has shown a positive trajectory in sales and profitability, despite rising costs and fluctuating margins.

View full answer

Who are the top shareholders of the Jasch Industries?

17-Jul-2025

The top shareholders of Jasch Industries include promoters, with Navneet Garg holding 18.02%, and individual investors collectively owning 29.61%. The highest public shareholder is Dheeraj Kumar Lohia at 3.55%, and there are no mutual funds or foreign institutional investors involved.

The top shareholders of Jasch Industries include the promoters, with Navneet Garg holding the highest individual stake at 18.02%. Additionally, individual investors collectively hold 29.61% of the shares. The highest public shareholder is Dheeraj Kumar Lohia, who owns 3.55%. Notably, there are no mutual funds or foreign institutional investors holding shares in the company.

View full answer

What is the technical trend for Jasch Industries?

09-Jun-2025

As of June 2, 2025, Jasch Industries shows a mildly bearish trend, with mixed signals from the MACD and moving averages across different time frames, indicating potential volatility without a clear direction.

As of 2 June 2025, the technical trend for Jasch Industries has changed from sideways to mildly bearish. The weekly MACD remains bullish, but the monthly MACD is mildly bearish, indicating mixed signals across time frames. The daily moving averages are mildly bearish, reinforcing the bearish sentiment in the short term. The KST shows a bullish trend weekly but is bearish monthly, adding to the mixed outlook. The Bollinger Bands indicate a mildly bullish stance on the weekly chart but are sideways on the monthly, suggesting potential volatility without a clear direction. Overall, the current technical stance is mildly bearish, driven primarily by the daily moving averages and the monthly MACD.

View full answer

Has Jasch Industries declared dividend?

06-Jun-2025

Yes, Jasch Industries Ltd has declared a 10% dividend, amounting to 1.0000 per share, with an ex-date of August 29, 2011. However, the dividend yield is currently 0%, indicating that returns are mainly from price appreciation rather than dividend income.

Jasch Industries Ltd has declared a 10% dividend.<BR><BR>Dividend Details:<BR>- Percentage announced: 10%<BR>- Amount per share: 1.0000<BR>- Ex-date: 29 Aug 11<BR><BR>Dividend Yield: 0%<BR><BR>Total Returns by Period:<BR>In the 6-month period, the price return was 9.37%, the dividend return was 0%, resulting in a total return of 9.37%.<BR><BR>For the 1-year period, the price return was 8.89%, the dividend return was 0%, leading to a total return of 8.89%.<BR><BR>Over 2 years, the price return was 17.3%, with a dividend return of 0%, culminating in a total return of 17.3%.<BR><BR>In the 3-year period, the price return was 27.08%, the dividend return was 0%, which resulted in a total return of 27.08%.<BR><BR>For the 4-year period, the price return was 84.26%, the dividend return was 0%, giving a total return of 84.26%.<BR><BR>Lastly, in the 5-year period, the price return was 694.41%, with a dividend return of 0%, resulting in a total return of 694.41%.<BR><BR>Overall, while Jasch Industries has declared a dividend, the dividend yield is currently 0%, indicating that the returns are primarily driven by price appreciation rather than dividend income. The total returns over various periods show significant growth, particularly over the longer term.

View full answer
iScoreScore
Click here to find our call on this stock
Strong Sell
Sell
Hold
Buy
Strong Buy

Dashboard

1

High Management Efficiency with a high ROCE of 30.34%

 
2

Strong ability to service debt as the company has a low Debt to EBITDA ratio of 2.09 times

 
3

The company has declared Positive results for the last 4 consecutive quarters

4

With ROCE of 10.5, it has a Fair valuation with a 2.1 Enterprise value to Capital Employed

5

Majority shareholders : Promoters

 
6

Market Beating performance in long term as well as near term

stock-summaryMojo Parameters

Mojo Parameters

Loading Valuation Snapshot...

Stock DNA

stock-summary
Industry

Garments & Apparels

stock-summary
Market cap

INR 205 Cr (Micro Cap)

stock-summary
P/E

9.00

stock-summary
Industry P/E

28

stock-summary
Dividend Yield

0.00%

stock-summary
Debt Equity

0.52

stock-summary
Return on Equity

19.44%

stock-summary
Price to Book

2.71

Revenue and Profits:
Net Sales:
75 Cr
(Quarterly Results - Jun 2026)
Net Profit:
4 Cr
stock-summaryTotal Returns
Total Returns (Price + Dividend) stock-summary
Dividend Yield (0%)
TimePeriod
Price Return
Dividend Return
Total Return
3 Months
95.2%
0%
95.2%
6 Months
84.49%
0%
84.49%
1 Year
69.1%
0%
69.1%
2 Years
69.2%
0%
69.2%
3 Years
71.5%
0%
71.5%
4 Years
116.34%
0%
116.34%
5 Years
148.88%
0%
148.88%

Latest dividend: 1.0000 per share ex-dividend date: Aug-29-2011

Risk Adjusted Returns v/s stock-summary
Returns Beta
Icon
Beta has not been calculated since enough price history is not available
stock-summaryNews & Corporate Actions

News

Jasch Industries Falls 6.04%: Quality Upgrade and Volatility Mark the Week

Key Events This Week

3 Aug: Quality grade upgraded to Good; Mojo Score 75.0 and Buy rating assigned

3 Aug: MarketsMOJO upgrades Jasch Industries to Buy on strong financial metrics

7 Aug: Stock closes at Rs.281.60, down 3.20% on the day and 6.04% for the week

Announcements stock-summary

Board Meeting Outcome for Results - Financial Results For The Quarter Ended 30.06.2026

30-Jul-2026 | Source : BSE

Unaudited Standalone Financial Results for the quarter ended on 30.06.2026 along with Limited Review Report of the auditors.

Results - Financial Results For The Quarter Ended 30.06.2026

30-Jul-2026 | Source : BSE

Unaudited Standalone Financial Results for the quarter ended on 30.06.2026 along with Limited Review Report of the Auditors.

Announcement under Regulation 30 (LODR)-Newspaper Publication

22-Jul-2026 | Source : BSE

Attached

Corporate Actions stock-summary

stock-summary
BOARD MEETING

No Upcoming Board Meetings

stock-summary
DIVIDEND

Jasch Industries Ltd has declared 10% dividend, ex-date: 29 Aug 11

stock-summary
SPLITS

No Splits history available

stock-summary
BONUS

No Bonus history available

stock-summary
RIGHTS

No Rights history available

stock-summaryKey Factors

Quality key factors stock-summary

Factor
Value
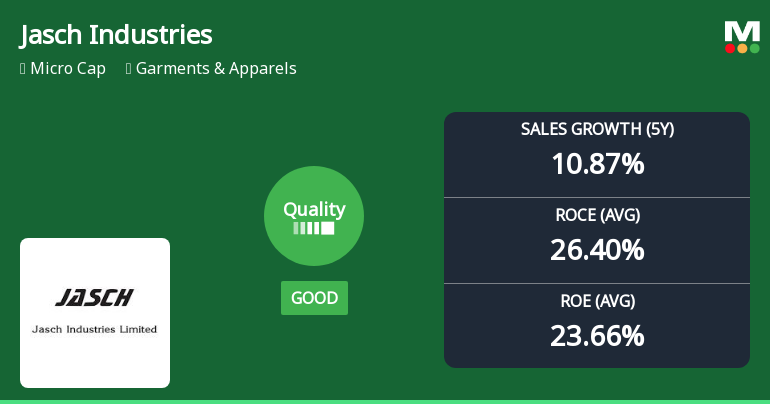
Sales Growth (5y)
10.87%
EBIT Growth (5y)
3.54%
EBIT to Interest (avg)
16.61
Debt to EBITDA (avg)
0.72
Net Debt to Equity (avg)
0.52
Sales to Capital Employed (avg)
2.06
Tax Ratio
25.76%
Dividend Payout Ratio
0
Pledged Shares
0
Institutional Holding
0
ROCE (avg)
26.40%
ROE (avg)
23.66%

Valuation key factors

Factor
Value
P/E Ratio
9
Industry P/E
28
Price to Book Value
2.71
EV to EBIT
11.40
EV to EBITDA
9.97
EV to Capital Employed
2.12
EV to Sales
0.95
PEG Ratio
0.15
Dividend Yield
NA
ROCE (Latest)
10.49%
ROE (Latest)
19.44%

Technicals key factors

Indicator
Weekly
Monthly
MACD
Bullish
Bullish
RSI
No Signal
No Signal
Bollinger Bands
Bullish
Bullish
Moving Averages
Bullish (Daily)
KST
Bullish
Bullish
Dow Theory
No Trend
No Trend
stock-summary Technical Indicator Scale: Bearish, Mildly Bearish, Sideways, Mildly Bullish, Bullish  Turned 
stock-summaryShareholding
Shareholding Snapshot : Jun 2026stock-summary
Shareholding Compare (%holding) stock-summary
Majority shareholders

Promoters

Pledged Promoter Holdings

None

Mutual Funds

Held by 0 Schemes

FIIs

Held by 0 FIIs

Promoter with highest holding

Navneet Garg (18.02%)

Highest Public shareholder

Dheeraj Kumar Lohia (3.61%)

Individual Investors Holdings

30.06%

stock-summaryFinancial
[
  {
    "link": "quarterly",
    "btn_text": "All Quarterly Results",
    "header": "Quarterly Results Snapshot (Standalone) - Jun'26 - QoQ",
    "rhs": [
      {
        "prefix": "Net Sales ",
        "suffix": "QoQ Growth in quarter ended Jun 2026 is -3.46% vs 36.25% in Mar 2026",
        "dir": -1
      },
      {
        "prefix": "Standalone Net Profit ",
        "suffix": "QoQ Growth in quarter ended Jun 2026 is -40.28% vs 147.29% in Mar 2026",
        "dir": -1
      }
    ],
    "table": {
      "header": [
        "Jun'26",
        "Mar'26",
        "Change(%)"
      ],
      "body": [
        {
          "field": "Net Sales",
          "val1": "75.26",
          "val2": "77.96",
          "chgp": "-3.46%",
          "chgp_class": "negative"
        },
        {
          "field": "Operating Profit (PBDIT) excl Other Income",
          "val1": "6.32",
          "val2": "9.75",
          "chgp": "-35.18%",
          "chgp_class": "negative"
        },
        {
          "field": "Interest",
          "val1": "0.51",
          "val2": "0.45",
          "chgp": "13.33%",
          "chgp_class": "negative"
        },
        {
          "field": "Exceptional Items",
          "val1": "0.00",
          "val2": "0.00",
          "chgp": "",
          "chgp_class": "neutral"
        },
        {
          "field": "Standalone Net Profit",
          "val1": "3.81",
          "val2": "6.38",
          "chgp": "-40.28%",
          "chgp_class": "negative"
        },
        {
          "field": "Operating Profit Margin (Excl OI)",
          "val1": "8.40%",
          "val2": "12.51%",
          "chgp": "-4.11%",
          "chgp_class": "negative"
        }
      ]
    }
  },
  {
    "link": "half-yearly",
    "btn_text": "All Half Yearly Results",
    "header": "Half Yearly Results Snapshot (Standalone) - Sep'25",
    "rhs": [
      {
        "prefix": "Net Sales ",
        "suffix": " Growth in half year ended Sep 2025 is 10.22% vs -0.55% in Sep 2024",
        "dir": 1
      },
      {
        "prefix": "Standalone Net Profit ",
        "suffix": " Growth in half year ended Sep 2025 is 33.13% vs -32.14% in Sep 2024",
        "dir": 1
      }
    ],
    "table": {
      "header": [
        "Sep'25",
        "Sep'24",
        "Change(%)"
      ],
      "body": [
        {
          "field": "Net Sales",
          "val1": "93.50",
          "val2": "84.83",
          "chgp": "10.22%",
          "chgp_class": "positive"
        },
        {
          "field": "Operating Profit (PBDIT) excl Other Income",
          "val1": "8.24",
          "val2": "6.46",
          "chgp": "27.55%",
          "chgp_class": "positive"
        },
        {
          "field": "Interest",
          "val1": "0.84",
          "val2": "0.78",
          "chgp": "7.69%",
          "chgp_class": "negative"
        },
        {
          "field": "Exceptional Items",
          "val1": "-0.12",
          "val2": "0.00",
          "chgp": "",
          "chgp_class": "neutral"
        },
        {
          "field": "Standalone Net Profit",
          "val1": "4.30",
          "val2": "3.23",
          "chgp": "33.13%",
          "chgp_class": "positive"
        },
        {
          "field": "Operating Profit Margin (Excl OI)",
          "val1": "8.81%",
          "val2": "7.62%",
          "chgp": "1.19%",
          "chgp_class": "positive"
        }
      ]
    }
  },
  {
    "link": "nine-monthly",
    "btn_text": "All Nine Monthly Results",
    "header": "Nine Monthly Results Snapshot (Standalone) - Dec'25",
    "rhs": [
      {
        "prefix": "Net Sales ",
        "suffix": "YoY Growth in nine months ended Dec 2025 is 12.41% vs 1.54% in Dec 2024",
        "dir": 1
      },
      {
        "prefix": "Standalone Net Profit ",
        "suffix": "YoY Growth in nine months ended Dec 2025 is 39.84% vs -39.78% in Dec 2024",
        "dir": 1
      }
    ],
    "table": {
      "header": [
        "Dec'25",
        "Dec'24",
        "Change(%)"
      ],
      "body": [
        {
          "field": "Net Sales",
          "val1": "150.72",
          "val2": "134.08",
          "chgp": "12.41%",
          "chgp_class": "positive"
        },
        {
          "field": "Operating Profit (PBDIT) excl Other Income",
          "val1": "12.89",
          "val2": "9.61",
          "chgp": "34.13%",
          "chgp_class": "positive"
        },
        {
          "field": "Interest",
          "val1": "1.26",
          "val2": "1.25",
          "chgp": "0.80%",
          "chgp_class": "negative"
        },
        {
          "field": "Exceptional Items",
          "val1": "-0.12",
          "val2": "0.00",
          "chgp": "",
          "chgp_class": "neutral"
        },
        {
          "field": "Standalone Net Profit",
          "val1": "6.88",
          "val2": "4.92",
          "chgp": "39.84%",
          "chgp_class": "positive"
        },
        {
          "field": "Operating Profit Margin (Excl OI)",
          "val1": "8.55%",
          "val2": "7.17%",
          "chgp": "1.38%",
          "chgp_class": "positive"
        }
      ]
    }
  },
  {
    "link": "annual",
    "btn_text": "All Annual Results",
    "header": "Annual Results Snapshot (Standalone) - Mar'26",
    "rhs": [
      {
        "prefix": "Net Sales ",
        "suffix": "YoY Growth in year ended Mar 2026 is 24.36% vs 7.17% in Mar 2025",
        "dir": 1
      },
      {
        "prefix": "Standalone Net Profit ",
        "suffix": "YoY Growth in year ended Mar 2026 is 76.90% vs -16.78% in Mar 2025",
        "dir": 1
      }
    ],
    "table": {
      "header": [
        "Mar'26",
        "Mar'25",
        "Change(%)"
      ],
      "body": [
        {
          "field": "Net Sales",
          "val1": "228.68",
          "val2": "183.88",
          "chgp": "24.36%",
          "chgp_class": "positive"
        },
        {
          "field": "Operating Profit (PBDIT) excl Other Income",
          "val1": "22.64",
          "val2": "13.58",
          "chgp": "66.72%",
          "chgp_class": "positive"
        },
        {
          "field": "Interest",
          "val1": "1.70",
          "val2": "1.61",
          "chgp": "5.59%",
          "chgp_class": "negative"
        },
        {
          "field": "Exceptional Items",
          "val1": "-0.11",
          "val2": "0.00",
          "chgp": "",
          "chgp_class": "neutral"
        },
        {
          "field": "Standalone Net Profit",
          "val1": "13.25",
          "val2": "7.49",
          "chgp": "76.90%",
          "chgp_class": "positive"
        },
        {
          "field": "Operating Profit Margin (Excl OI)",
          "val1": "9.90%",
          "val2": "7.39%",
          "chgp": "2.51%",
          "chgp_class": "positive"
        }
      ]
    }
  }
]

Quarterly Results Snapshot (Standalone) - Jun'26 - QoQstock-summary

Jun'26
Mar'26
Change(%)
Net Sales
75.26
77.96
-3.46%
Operating Profit (PBDIT) excl Other Income
6.32
9.75
-35.18%
Interest
0.51
0.45
13.33%
Exceptional Items
0.00
0.00
Standalone Net Profit
3.81
6.38
-40.28%
Operating Profit Margin (Excl OI)
8.40%
12.51%
-4.11%
Values in Rs Cr.
Direction Arrows
Net Sales

QoQ Growth in quarter ended Jun 2026 is -3.46% vs 36.25% in Mar 2026

Direction Arrows
Standalone Net Profit

QoQ Growth in quarter ended Jun 2026 is -40.28% vs 147.29% in Mar 2026

Half Yearly Results Snapshot (Standalone) - Sep'25stock-summary

Sep'25
Sep'24
Change(%)
Net Sales
93.50
84.83
10.22%
Operating Profit (PBDIT) excl Other Income
8.24
6.46
27.55%
Interest
0.84
0.78
7.69%
Exceptional Items
-0.12
0.00
Standalone Net Profit
4.30
3.23
33.13%
Operating Profit Margin (Excl OI)
8.81%
7.62%
1.19%
Values in Rs Cr.
Direction Arrows
Net Sales

Growth in half year ended Sep 2025 is 10.22% vs -0.55% in Sep 2024

Direction Arrows
Standalone Net Profit

Growth in half year ended Sep 2025 is 33.13% vs -32.14% in Sep 2024

Nine Monthly Results Snapshot (Standalone) - Dec'25stock-summary

Dec'25
Dec'24
Change(%)
Net Sales
150.72
134.08
12.41%
Operating Profit (PBDIT) excl Other Income
12.89
9.61
34.13%
Interest
1.26
1.25
0.80%
Exceptional Items
-0.12
0.00
Standalone Net Profit
6.88
4.92
39.84%
Operating Profit Margin (Excl OI)
8.55%
7.17%
1.38%
Values in Rs Cr.
Direction Arrows
Net Sales

YoY Growth in nine months ended Dec 2025 is 12.41% vs 1.54% in Dec 2024

Direction Arrows
Standalone Net Profit

YoY Growth in nine months ended Dec 2025 is 39.84% vs -39.78% in Dec 2024

Annual Results Snapshot (Standalone) - Mar'26stock-summary

Mar'26
Mar'25
Change(%)
Net Sales
228.68
183.88
24.36%
Operating Profit (PBDIT) excl Other Income
22.64
13.58
66.72%
Interest
1.70
1.61
5.59%
Exceptional Items
-0.11
0.00
Standalone Net Profit
13.25
7.49
76.90%
Operating Profit Margin (Excl OI)
9.90%
7.39%
2.51%
Values in Rs Cr.
Direction Arrows
Net Sales

YoY Growth in year ended Mar 2026 is 24.36% vs 7.17% in Mar 2025

Direction Arrows
Standalone Net Profit

YoY Growth in year ended Mar 2026 is 76.90% vs -16.78% in Mar 2025

stock-summaryCompany CV
About Jasch Industries Ltd stock-summary
stock-summary
Jasch Industries Ltd
Micro Cap
Garments & Apparels
Jasch Industries Limited (JIL) was established in December, 1985. The Company manufactures PU Resins and PVC/PU Coated Fabrics i.e. Synthetic Leather/ Artificial Leather & Allied Products & Nucleonic & X-Ray Source based Thickness Gauging Systems in Electronic Gauge Division. Engaged in the manufacture of PU foam and laminated products, JIL set up manufacturing facilities for PU resin, PU synthetic leather and non-woven fabric for captive consumption in manufacturing PU leather.
Company Coordinates stock-summary
Company Details
43/5 Bahalgarh Road, Bahalgarh P O Sonepat Haryana : 131021
stock-summary
Tel: 91-130-3053600
stock-summary
skverma@jasch.biz
Registrar Details
Alankit Assignments Ltd , Alankit House , 2 E/21, Jhandewala Extension, New Delhi