
Compare Jattashankar Ind with Similar Stocks
Dashboard
Weak Long Term Fundamental Strength with an average Return on Equity (ROE) of 3.59%
- Poor long term growth as Operating profit has grown by an annual rate 6.50% of over the last 5 years
- Company's ability to service its debt is weak with a poor EBIT to Interest (avg) ratio of -0.01
With ROE of 5.5, it has a Very Expensive valuation with a 9.7 Price to Book Value
Stock DNA
Garments & Apparels
INR 193 Cr (Micro Cap)
177.00
25
0.00%
0.00
5.49%
9.70
Total Returns (Price + Dividend) 
Jattashankar Ind for the last several years.
Risk Adjusted Returns v/s
Returns Beta

News
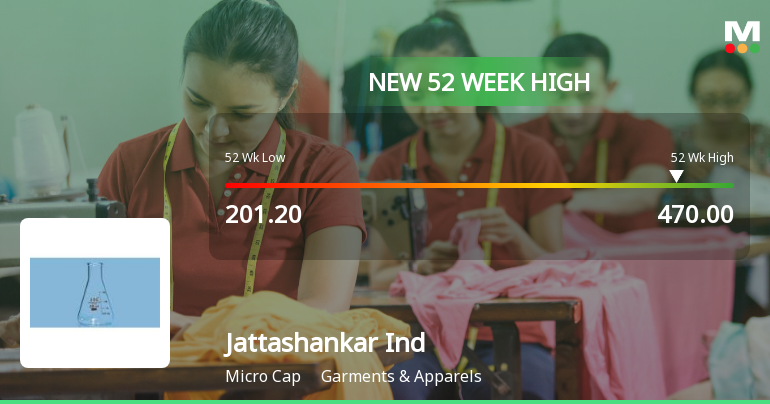
Broad-Based Technical Strength Lifts Jattashankar Industries Ltd to 52-Week High of Rs 470
Surging to an intraday peak of Rs 470 on 30 Jun 2026, Jattashankar Industries Ltd has marked a significant milestone by hitting a fresh 52-week high. This rally comes amid a backdrop of strong technical momentum and a year-to-date return of 57.47%, comfortably outperforming the Sensex’s decline of 8.42% over the same period.
Read full news article

Jattashankar Industries Ltd is Rated Sell
Jattashankar Industries Ltd is rated 'Sell' by MarketsMOJO, with this rating last updated on 27 January 2026. However, the analysis and financial metrics discussed here reflect the stock's current position as of 24 June 2026, providing investors with an up-to-date view of the company’s fundamentals, valuation, financial trends, and technical outlook.
Read full news article Announcements
Board Meeting Outcome for Outcome Of Board Meeting Held Today I.E. Friday 26Th June 2026
26-Jun-2026 | Source : BSEwe hereby inform you that the meeting of the Board of Directors of the Company was held today i.e. Friday 26th June 2026 at the Corporate Office of the Company which commenced at 02:30 P.M. and concluded at 03:15 P.M. The Board inter alia considered and approved the Allotment of 1600000 (Sixteen Lakhs) Convertible Warrants.
Board Meeting Outcome for Outcome Of Board Meeting Held Today I.E. Wednesday 24Th June 2026
24-Jun-2026 | Source : BSEwe hereby inform you that the meeting of the Board of Directors of the Company was held today i.e. Wednesday 24th June 2026 at the Corporate Office of the Company which commenced at 06:45 P.M. and concluded at 07:20 P.M. The Board inter alia considered and approved the Allotment of 1425000 (Fourteen Lakhs Twenty-Five Thousand) Convertible Warrants.
Board Meeting Outcome for Outcome Of Board Meeting Held Today I.E. Tuesday 23Rd June 2026
23-Jun-2026 | Source : BSEwe hereby inform you that the meeting of the Board of Directors of the Company was held today i.e. Tuesday 23rd June 2026 at the Corporate Office of the Company which commenced at 06:30 P.M. and concluded at 07:00 P.M. The Board inter alia considered and approved the Allotment of 3000000 (Thirty Lakhs) Convertible Warrants (Warrants) the person(s) and/or entity(ies) belonging to the Promoter and Promoter Group and Non-Promoter Category on a preferential basis.
Corporate Actions

No Upcoming Board Meetings

No Dividend history available

No Splits history available

No Bonus history available

No Rights history available
Quality key factors
Valuation key factors
Technicals key factors
 Technical Indicator Scale: Bearish, Mildly Bearish, Sideways, Mildly Bullish, Bullish Turned
 Shareholding Snapshot : Mar 2026
Shareholding Compare (%holding)
Promoters
None
Held by 0 Schemes
Held by 0 FIIs
Nileshbhai Bhagvanji Bapodara (16.46%)
Laxmikant Singrodia (7.36%)
25.22%
Quarterly Results Snapshot (Standalone) - Mar'26 - YoY

YoY Growth in quarter ended Mar 2026 is 0.00% vs -100.00% in Mar 2025
YoY Growth in quarter ended Mar 2026 is 283.87% vs -109.42% in Mar 2025
Half Yearly Results Snapshot (Standalone) - Sep'25

Growth in half year ended Sep 2025 is -99.02% vs -8.63% in Sep 2024
Growth in half year ended Sep 2025 is 129.79% vs -238.24% in Sep 2024
Nine Monthly Results Snapshot (Standalone) - Dec'25
YoY Growth in nine months ended Dec 2025 is 585.68% vs -33.95% in Dec 2024
YoY Growth in nine months ended Dec 2025 is 151.14% vs -266.04% in Dec 2024
Annual Results Snapshot (Standalone) - Mar'26
YoY Growth in year ended Mar 2026 is 1,483.97% vs -49.91% in Mar 2025
YoY Growth in year ended Mar 2026 is 186.55% vs -131.15% in Mar 2025
About Jattashankar Industries Ltd

Company Coordinates


